Zombie Stats: Where the Numbers AI Quotes Come From Research
We asked five AI assistants 200 questions that call for a number and followed 1,285 of the statistics they cited back to the source.
We asked five AI assistants 200 questions that call for a number and followed 1,285 of the statistics they cited back to the source.
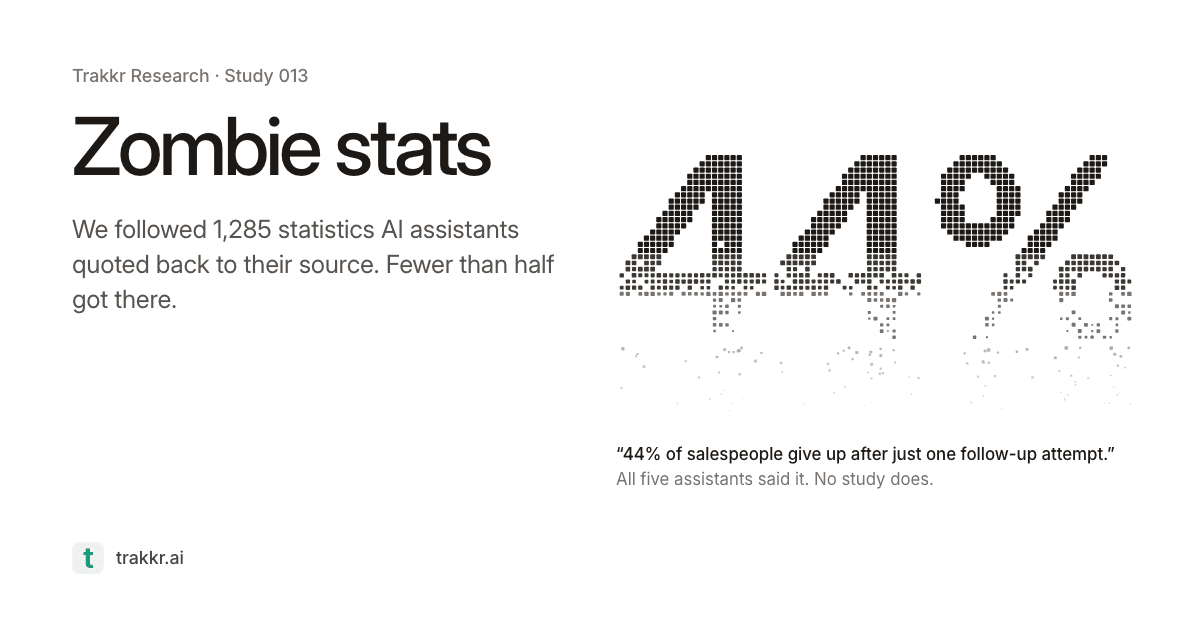
We asked ChatGPT, Perplexity, Gemini, Claude and Google’s AI Overviews 200 questions that call for a number, the kind people ask every day. Then we clicked the citations, and kept clicking. Here is one trail, from the answer to the end.
Google AI Overviews
What percentage of salespeople give up after one follow-up?
44% of salespeople give up after just one follow-up attempt.
44% of salespeople give up after one follow-up attempt (source).
80 Percent of Sales Require 5 Follow-up Calls after Meeting; 44 Percent Salespeople Give Up After One Follow-up
No study behind itThis page cites no research.
Every assistant got the same question: “What percentage of salespeople give up after one follow-up?” All five assistants gave the same figure, and only ChatGPT said the evidence behind it was unclear.
Google AI Overviews cited a sales firm’s stats page, from 2020. The number is right there. Its “source” link goes to a writing sample.
That leads to a freelance writer’s sample article, online by 2017. The number is in its headline. It lists two slide decks, a blog list and two news stories. None is a study of follow-ups.
That’s where the trail ends. We tried every other route to this number we could find, and each one stopped at a page that cites no research. This is what we mean by a zombie stat: a number that keeps getting repeated with no study behind it.
Most numbers aren’t like this one. The trouble is that you can’t tell which ones are from the answer. This one came with the same confident tone and the same kind of citation as any other, and all five assistants agreed on it. So we followed 1,285 statistics the same way.
We took a random sample of the statistics each assistant cited, 1,285 in all, and walked every trail the same way: the cited page, then that page’s source, up to five pages deep. Where a page named a source without a link, we searched for it.
40% reached a study that says the same thing. Another 8% reached the study, but the number or its context had changed on the way. The rest never got there: 40% stopped at a source we couldn’t check, because it was locked, gone or silent on the number, and 11% led nowhere at all.
Each square is one in a hundred of the 1,285 statistics we traced, sorted by where its trail ended.
The last 1%: trails whose pages wouldn’t load for us.
ChatGPT did best, and quoted the fewest numbers: 1.3 per answer, against 6.8 for Claude. The other four landed between 38% and 46%, too close to rank.
The same hundred squares for each assistant, from its own sample of cited statistics.
ChatGPT
57% sourced
1.3 statistics per answer
Perplexity
46% sourced
2.2 statistics per answer
AI Overviews
39% sourced
4.8 statistics per answer
Gemini
38% sourced
6.2 statistics per answer
Claude
38% sourced
6.8 statistics per answer
To check this wasn’t down to the questions we picked, we also traced 300 statistics from Google AI Overviews answers to real everyday searches. 40% were sourced, about the same share.
The AI mostly wasn’t making numbers up. The page it cited had the figure 82% of the time. But only 21% of the pages cited for a number were the original research.
More than half were company blogs. Add news stories and statistics roundups and you have most of the citations: pages that repeat figures from somewhere else, often without linking to it.
Every page an assistant cited first for a number, by kind. Each column’s width is its share of those citations. Green is how often its trails reached a study that says the same thing.
62%
Research firm13% of citations
Research firm or survey: 13% of first citations, 62% of them sourced.
61%
Government7% of citations
Government or official body: 7% of first citations, 61% of them sourced.
37%
Company blog54% of citations
Company blog: 54% of first citations, 37% of them sourced.
37%
News10% of citations
News or magazine: 10% of first citations, 37% of them sourced.
35%
Stats roundup8% of citations
Stats roundup: 8% of first citations, 35% of them sourced.
41%
Other8% of citations
Other: 8% of first citations, 41% of them sourced.
The first page made a big difference. When a trail started at a research firm or a government page, it reached a matching study 61% of the time. From a company blog, 37%; from a statistics roundup, 35%. Even research firms fell short 38% of the time, often because the full report sat behind a form.
A citation tells you where the AI found a number, not where the number came from.
Reaching the study didn’t always mean the number held. Of the statistics that got there, 17% had changed on the way. The digits moved only about one time in four. Usually it was the context: what was measured, the year, the source, or who was asked.
What changed, across every change we logged
The number changed26%
What was measured changed20%
The year changed17%
The source changed16%
Who was asked changed14%
The place changed4%
In one case, a 2004 study of 15 women judging health websites turned into a claim about first impressions of every website. Below are the clearest trails we followed, each checked by hand.
Each trail runs from the original study to an answer an assistant gave in October 2026. Step along it: the number stays, and the words around it change.
AskedWhat percentage of first impressions of a website are design-related?
The study · Sillence and colleagues, CHI, 2004
Of the comments 15 women made about rejecting or mistrusting health websites, 94% were about design.
A 2004 study watched 15 British women judge health websites, and 94% of their comments about rejecting a site were about design. Twenty years of retelling made it “94% of first impressions are design-related”, and Google AI Overviews states it as fact.
Step 1 of 4
Ask five assistants the same question and you’ll often get five different numbers. On 28 of the 71 questions where all five gave a percentage, we got four or five different figures.
Asked “What percentage of marketers use marketing automation tools?”, word for word, on the same day.
49–51%AI Overviews
62%ChatGPT
70–79%Gemini
81%Perplexity
96%Claude
Across those questions, the typical gap between the highest figure and the lowest was 16 points.
Every question where all five gave a percentage, one line each, from the lowest figure to the highest. Closest at the top.
Closest20 points or more apartFurthest apart
When all five agreed, the number wasn’t any more likely to check out. They gave the same figure on 10 questions, and of the 5 we traced, 2 were sourced. The statistics quoted by three or more assistants did no better: 11 of 29 were sourced.
Four were quoted by all five assistants, and we couldn’t find a study behind any of them.
Four statistics every assistant gave us, each with a trail that ends at a page citing no research.
Every trail ends at a page that cites no research, one of them a freelance writer’s sample article. Its full trail opens chapter 1.
Quoted by all five
Stated with no source. No study with this figure was found.
Quoted by all five
Repeated with no source, often credited to an old marketing roundup that no longer carries it. No study was found.
Quoted by all five
A 2014 Harvard Business Review article gives the range “depending on which study you believe”, and names none.
Quoted by all five
Each was quoted by at least three of the five assistants, most often first, and its trail checked by hand.
Generative AI pilots that fail to deliver a measurable financial return
MIT NANDA’s 2025 report says 95% of organizations got no return from generative AI. That isn’t the same as 95% of pilots failing.
5 of 5ChangedStudy from 2025Unhappy customers who actually complain
Goes back to TARP’s 1979 research for the White House consumer office. Its author says rates that low apply to small purchases; in 2016, 22% to 41% complained about their most serious problem.
5 of 5ChangedStudy from 1979Time people spend on social media each day
DataReportal’s Digital 2025 report, from GWI survey data: the typical internet user spends 2 hours 21 minutes a day on social media.
5 of 5SourcedStudy from 2025Google searches with local intent
Traces to a 2018 social post about a slide at a search conference. Google never published it, as far as we could find.
5 of 5Can’t checkFirst impressions of a website that are about its design
Began as a 2004 study of how 15 women judged health websites. Its full trail is in chapter 4.
5 of 5ChangedStudy from 2004If the cited page is a list of statistics or a company blog, use its own link to go one page further. Keep going until you reach the study itself, or until you can’t.
Most of the changes we found were in the context, not the digits: one country’s poll, a ten-year-old study, fifteen people.
Five assistants giving the same number isn’t five sources. The numbers they repeated most were no better sourced than the rest.
The sample, the date and a link to the source, on the same page as the figure, so the next page, and the next answer, can trace it back to you.
Reports behind a form were a common dead end: even trails that started at a research firm fell short 38% of the time. Put the headline numbers and the method on an open page.
It is often a roundup or a blog that copied you, sometimes with an older figure. That page decides what people hear.
Texto de trakkr.ai tal como lo publicó, leído de su página y mostrado aquí con el formato de El Autómata. El original, en trakkr.ai · Volver a la noticia de El Autómata