What thousands of conversations look like inside a language model
I mapped thousands of conversations inside Qwen to see how language takes shape.
I mapped thousands of conversations inside Qwen to see how language takes shape.

Every conversation that could happen with a language model–every question, misunderstanding, explanation, and unfinished argument–produces a sequence of internal states.
Could we map that landscape? Would conversations about similar things travel through neighboring regions? Would the same idea, expressed in different languages, arrive somewhere recognizably similar?
Those questions led me to build an interactive atlas of Qwen3-1.7B’s internal representations.
Before looking at the maps, it helps to know what is being mapped. The model breaks text into tokens – words, parts of words, or punctuation. Each token selects a row from an embedding table: a learned list of numbers that supplies its starting representation.
I wanted to map thousands of conversations and see how they take shape in vector space. The vectors I’m interested in come from the residual stream, the model’s central shared workspace. The embedding table supplies its starting vectors, with one vector at each token position, and the layers read from and add to this workspace as they process the text. Taras Tsugrii’s chapter on the residual stream explains this perspective in more detail.
In Qwen3-1.7B, each position’s vector contains 2,048 numbers. Calling this a model’s “mind” is a metaphor, but the vectors are concrete: we can record them, compare them, and examine how their geometry changes with context.
I began with 100 topics and generated question-and-answer examples across English, Chinese, German, and Croatian, alongside a separate collection of coding examples. This was a small, deliberately constructed sample of a much larger possibility space.
Before examining a conversation, I wanted to see the model’s starting vectors. Each input token is associated with a learned row in the embedding table. Those vectors become the initial representations that the model’s layers transform.
Each point in the orange cloud below represents one token’s input embedding, projected into three dimensions. A token can be a whole word, part of a word, or punctuation. The embedding table appears here as a cloud of starting points, with no conversation order connecting them. Rotating it gives a first glimpse of their geometry.
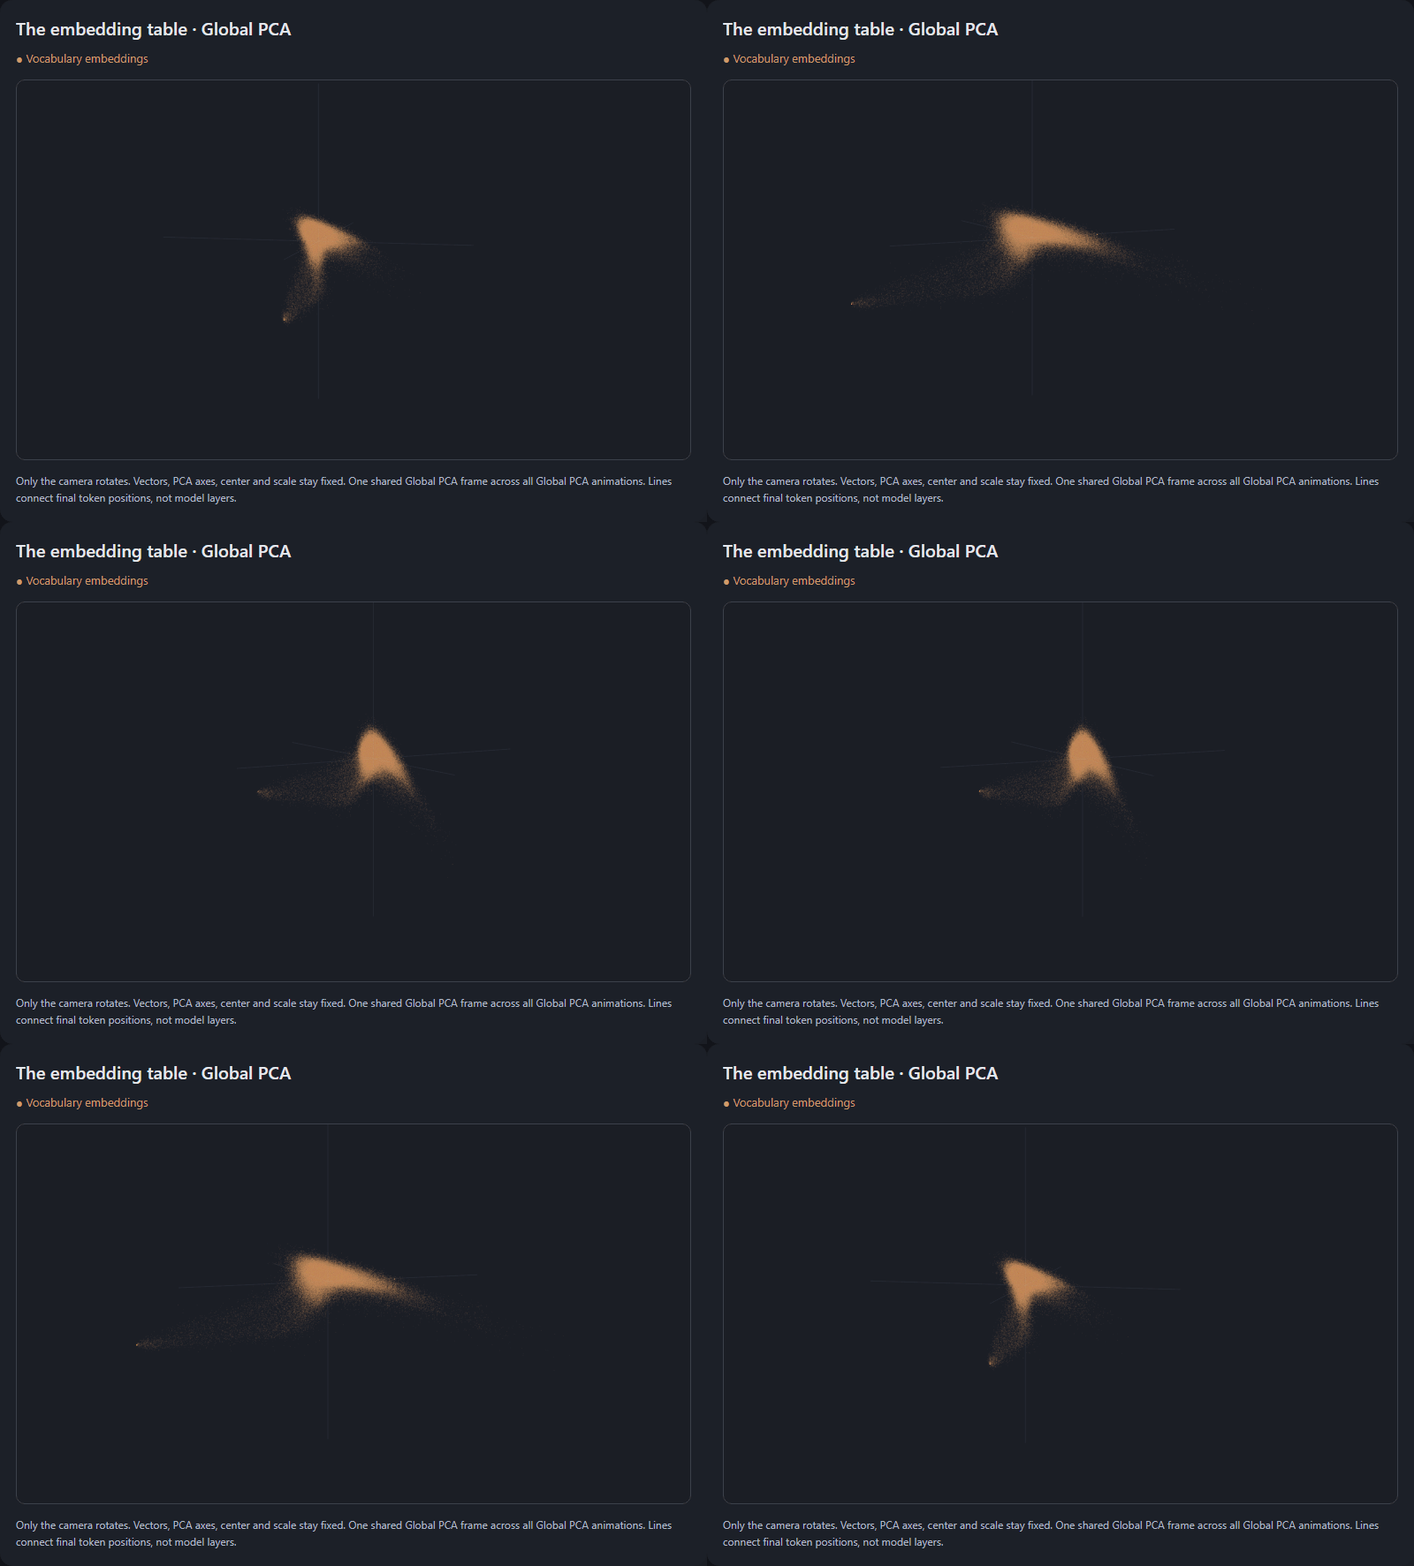
The embedding table already encodes learned relationships between tokens. Training shapes these vectors through patterns in how tokens are used, giving the model a meaningful starting point for understanding and processing text. The layers then refine those starting representations using the context available at each position. A whole conversation contains many token states, rather than one single 2,048-number description.
I started with 900 English question-and-answer examples across 100 topics, all processed by the same frozen model.
Each token begins with a learned vector from the embedding table. Qwen’s layers update its representation using the context available at that position. I recorded the final token states and normalized their lengths so the visualization compared directions.
Whereas the orange points show each token’s starting embedding, the colored lines connect the states the model produces from those embeddings. Each token – a word, part of a word, or punctuation – is transformed from its starting vector into a final state shaped by the conversation so far. Connecting these final states in text order gives one colored path per conversation, with many conversations shown together.
To keep the comparison fair, I computed one Global PCA frame using the vocabulary embeddings and all the conversation averages. I then revealed the datasets one at a time. Adding a language to these pictures changes visibility, while the global axes stay fixed.
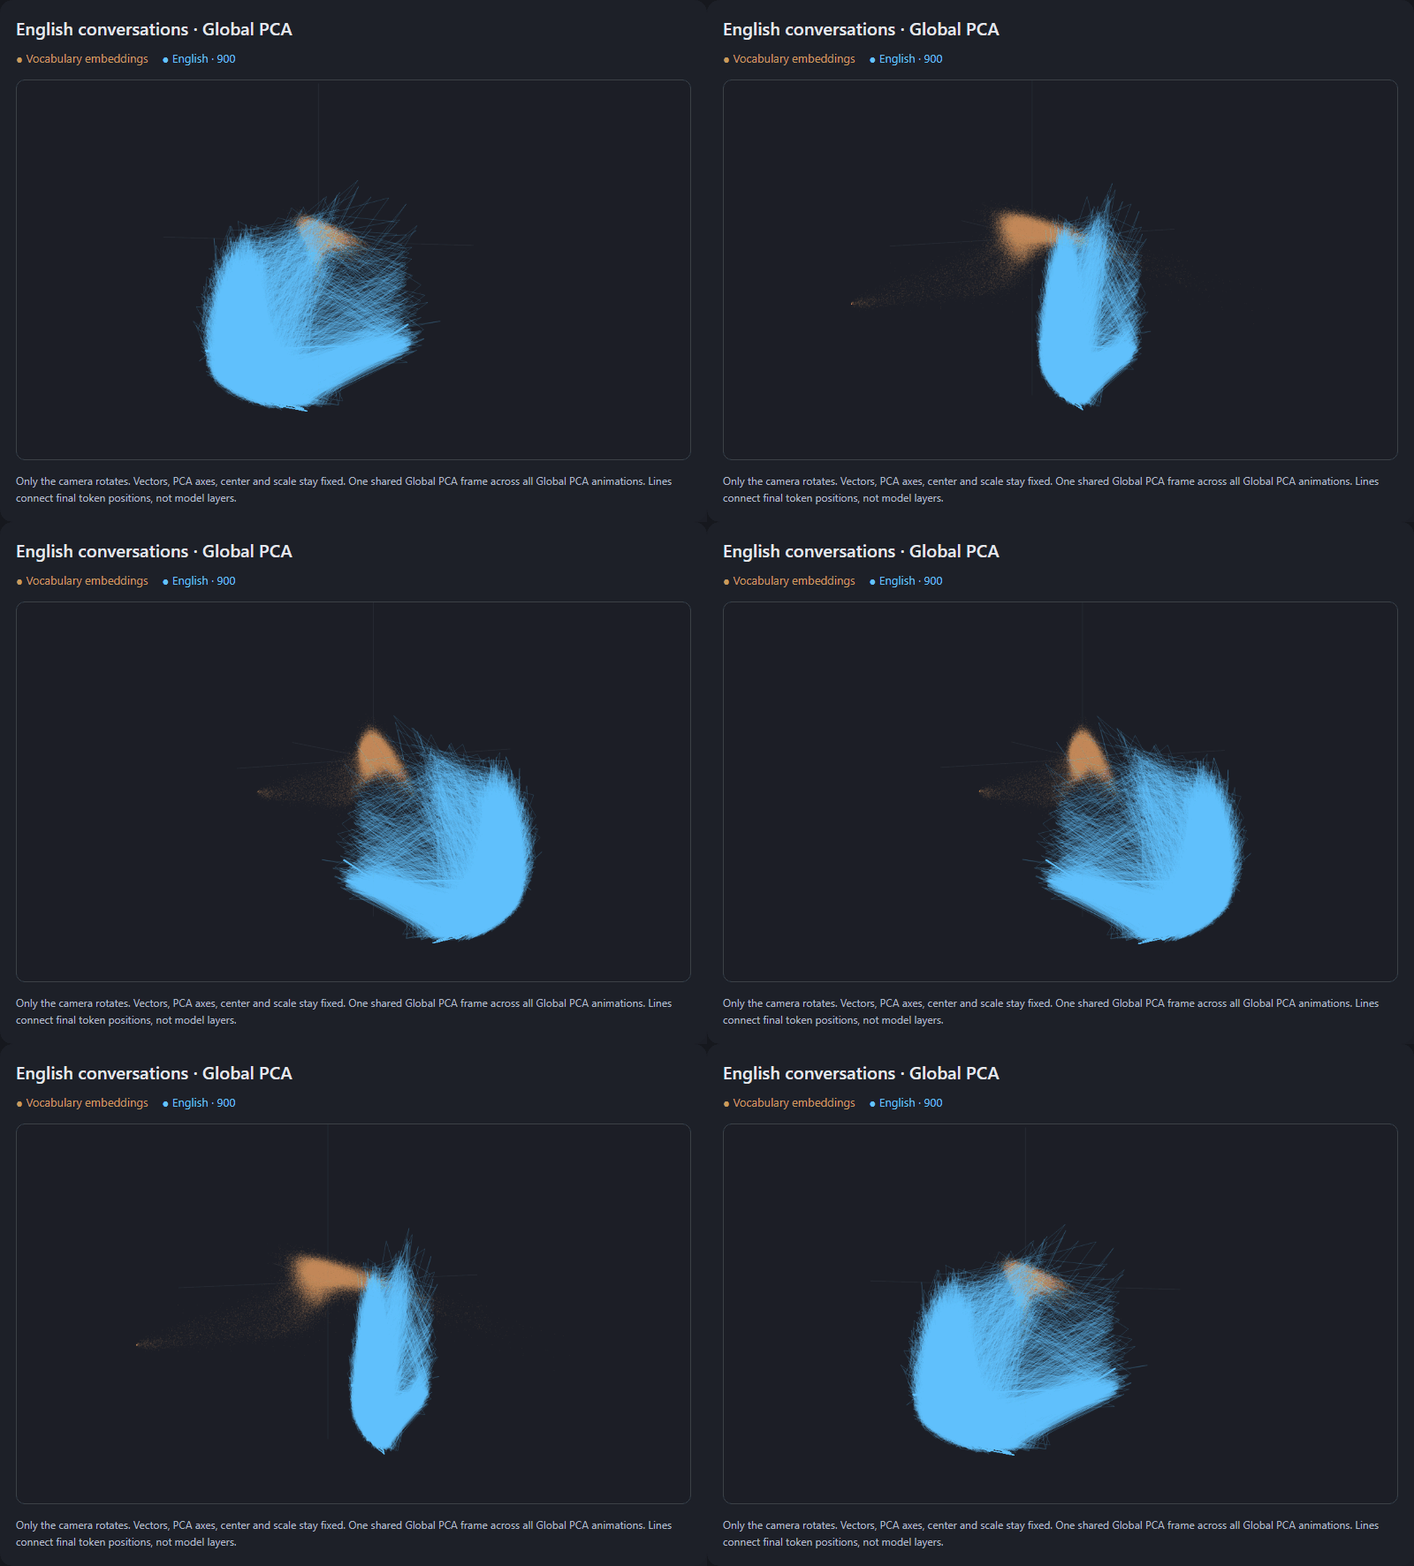
Across a hundred topics, the English states seemed to occupy a thin sheet. As the camera turned, a broad shape narrowed almost to an edge.
That impression survived measurement: a best-fitting plane contained approximately 99.3% of the English token states’ variation within this 3D projection.
It was tempting to interpret the sheet as evidence that the model had compressed an enormous variety of conversations into a remarkably simple surface. Before accepting that explanation, I wanted to change something more fundamental than the topic.
I introduced Chinese versions of the same topics and question intents, then let Qwen generate its answers independently.
The pink states appeared in a neighboring region, visibly offset from English.
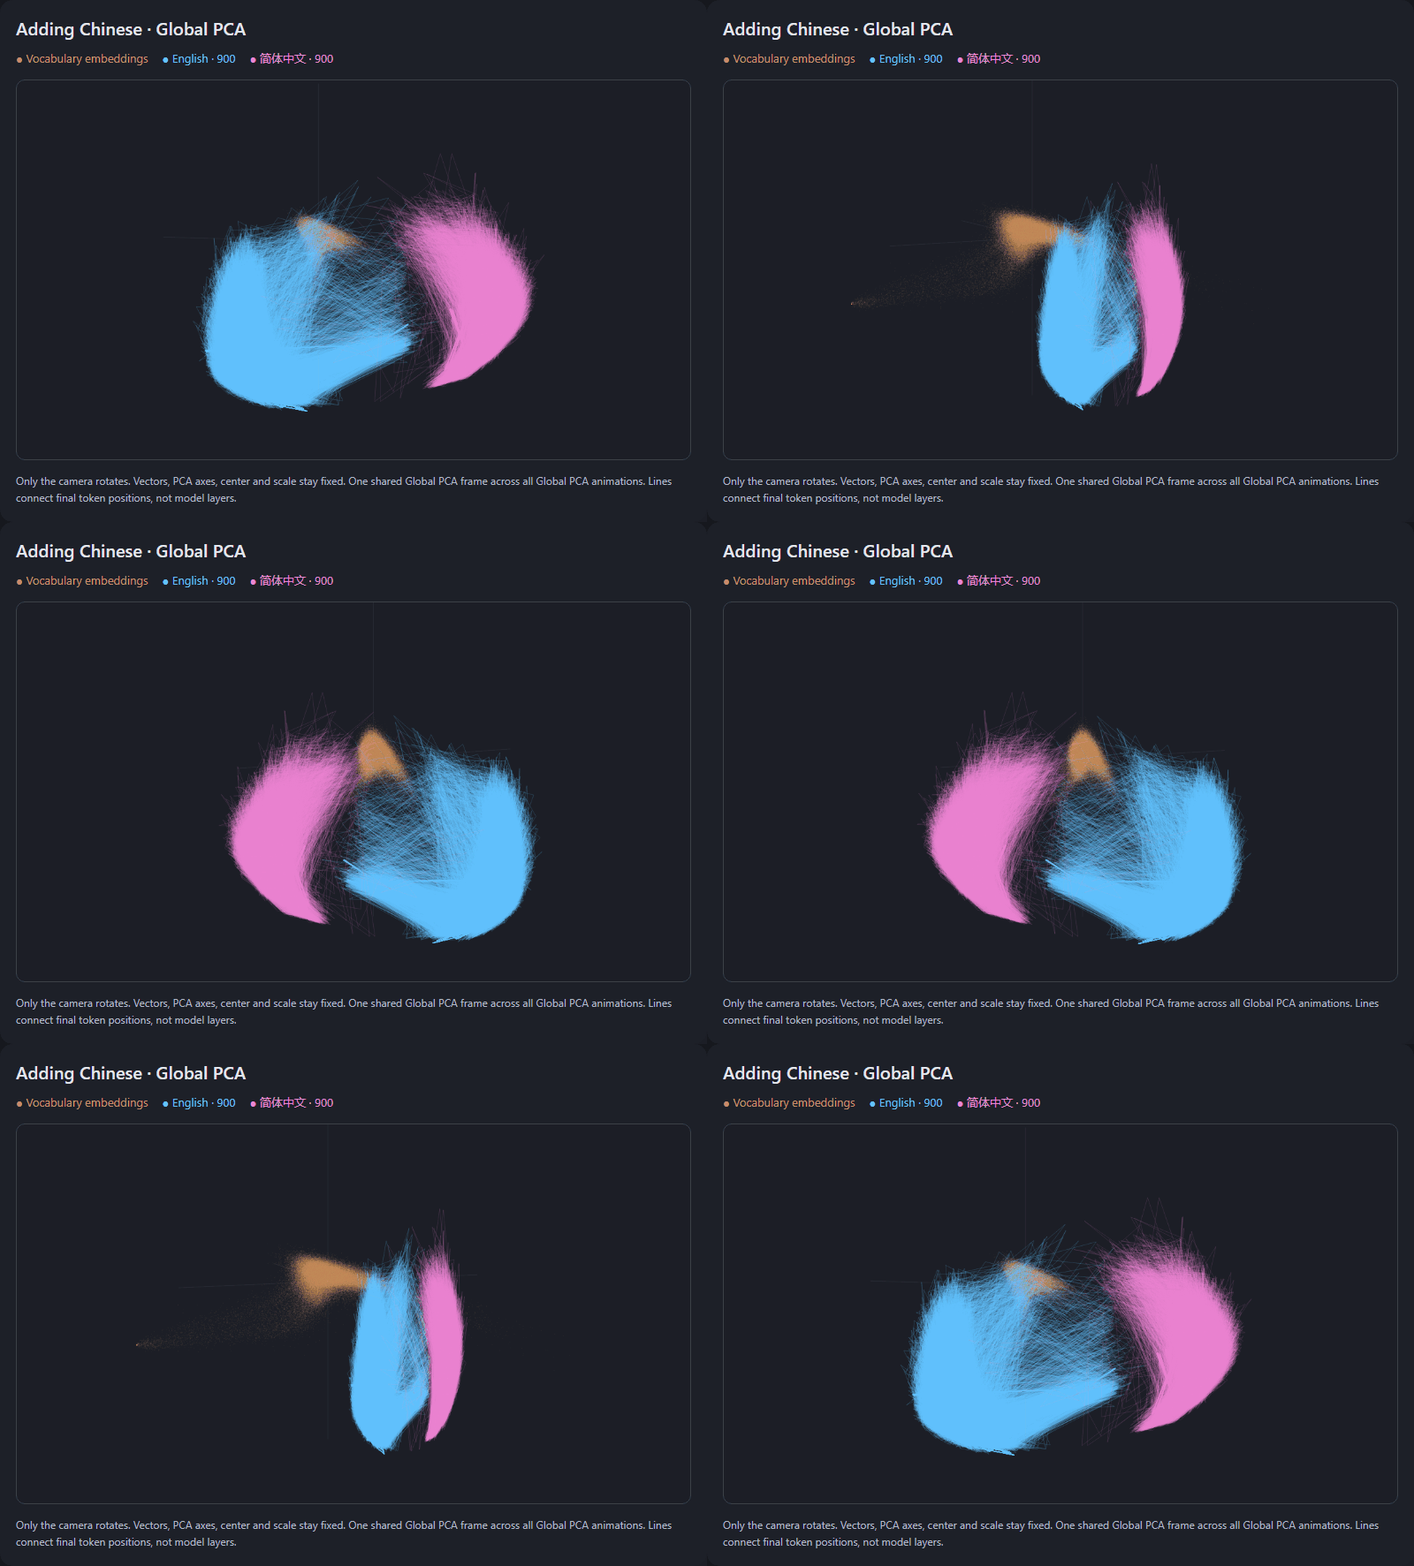
The separation made an abstract question tangible. A representation can carry information about both the subject being discussed and the language used to discuss it.
If similar questions in Chinese and English occupy different regions, what does that separation represent? The idea itself? The writing system? The vocabulary and structure the model needs to produce its answer?
The geometry alone could not disentangle those possibilities. Language, script, tokenization, wording, and answer quality all changed together in this experiment.
Perhaps expecting a representation to contain “pure meaning,” cleanly detached from the form used to express it, was already an assumption I had brought to the map.
Then I added German and Croatian.
These offered a useful comparison: two more natural languages using Latin-script writing.
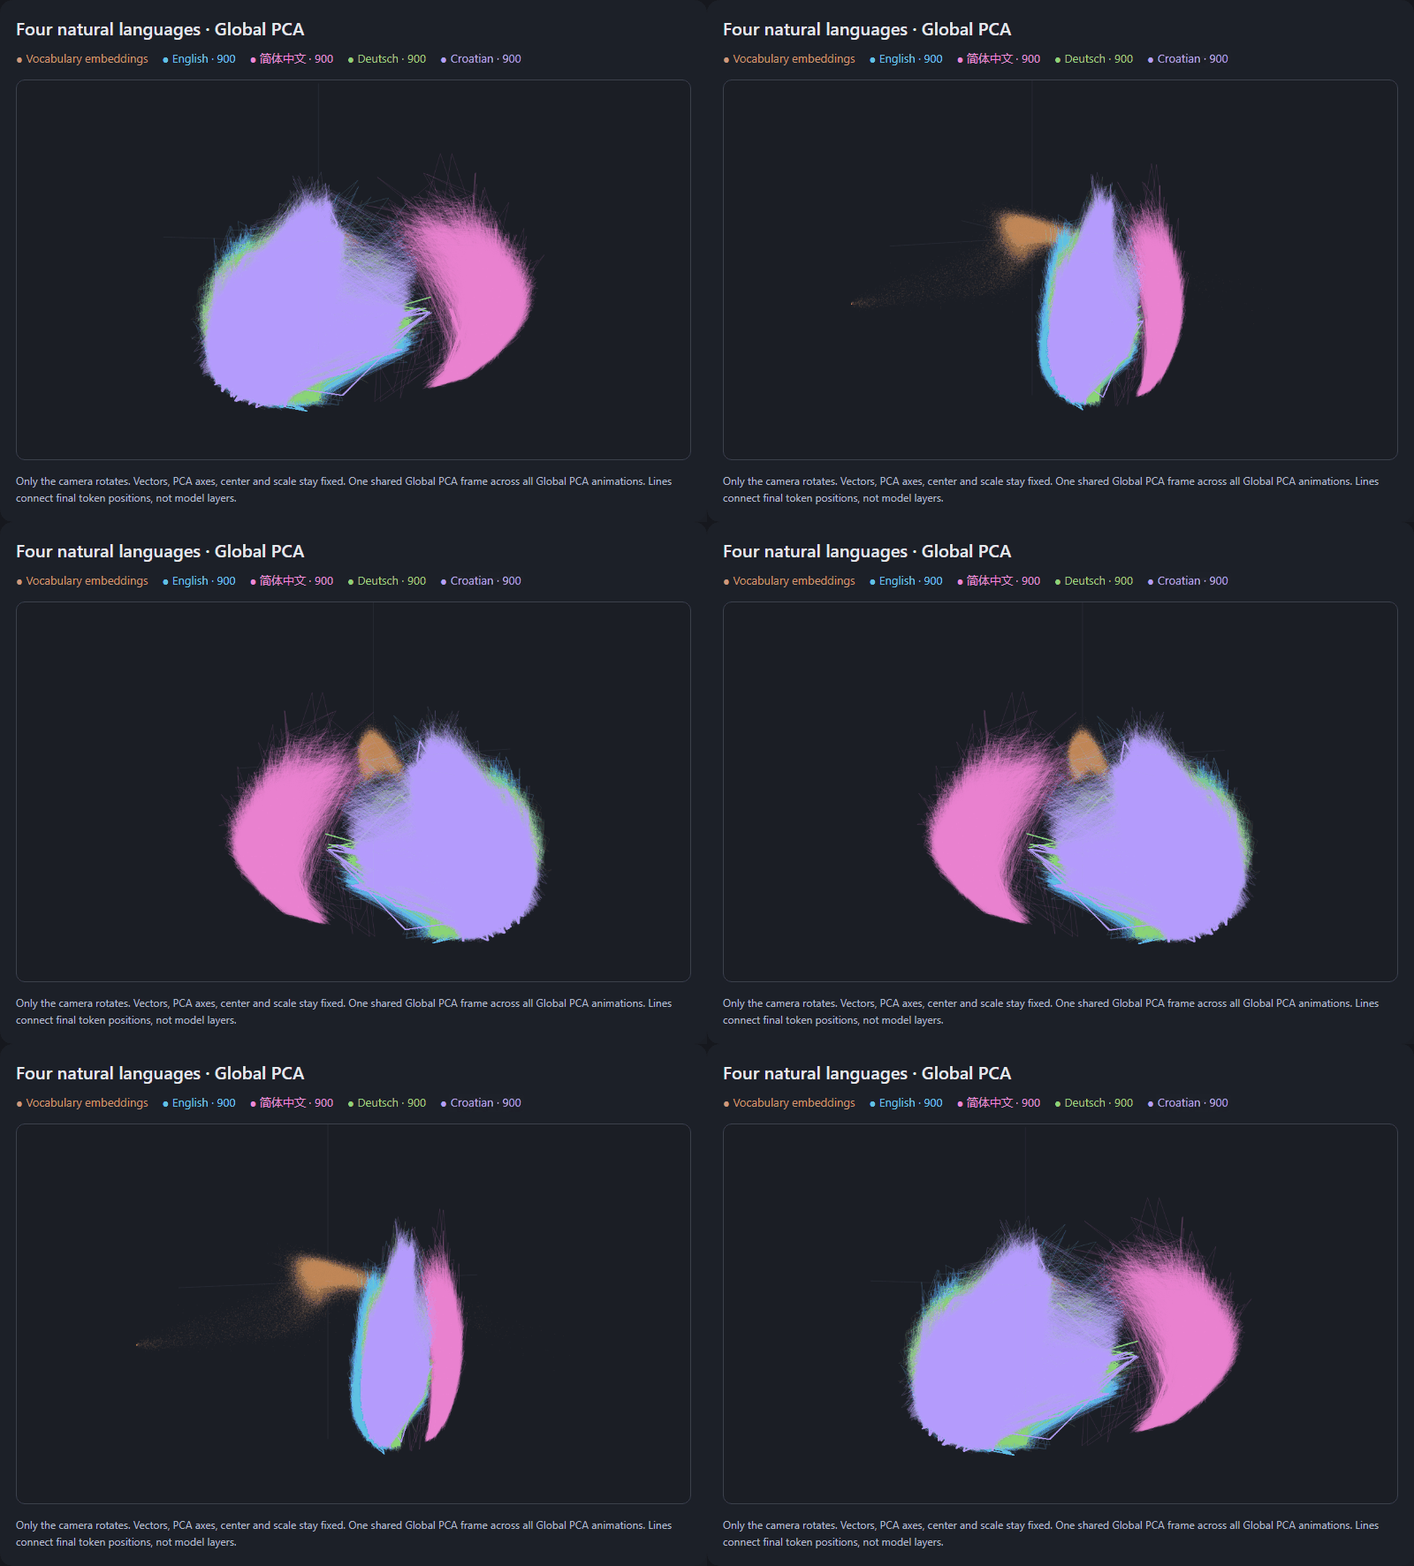
German and Croatian occupied the broad neighborhood of English, with substantial overlap. Chinese remained more visibly offset in this view.
The picture suggested overlapping regions with different centers and shapes. It did not establish separate language compartments throughout the model’s entire residual space.
The shapes also reflected the practical construction of the examples. Croatian responses contained many more Qwen tokens than the English responses. More token states produce more points and line segments. A larger or denser patch therefore cannot be read directly as greater knowledge or capacity.
I was beginning to distinguish the appearance of a region from the explanations I wanted to attach to it.
Next came 90 Python coding examples: list processing, sorting, binary search, graph traversal, JSON, dates, matrices, recursion, and classes.
Would code form a distant island?
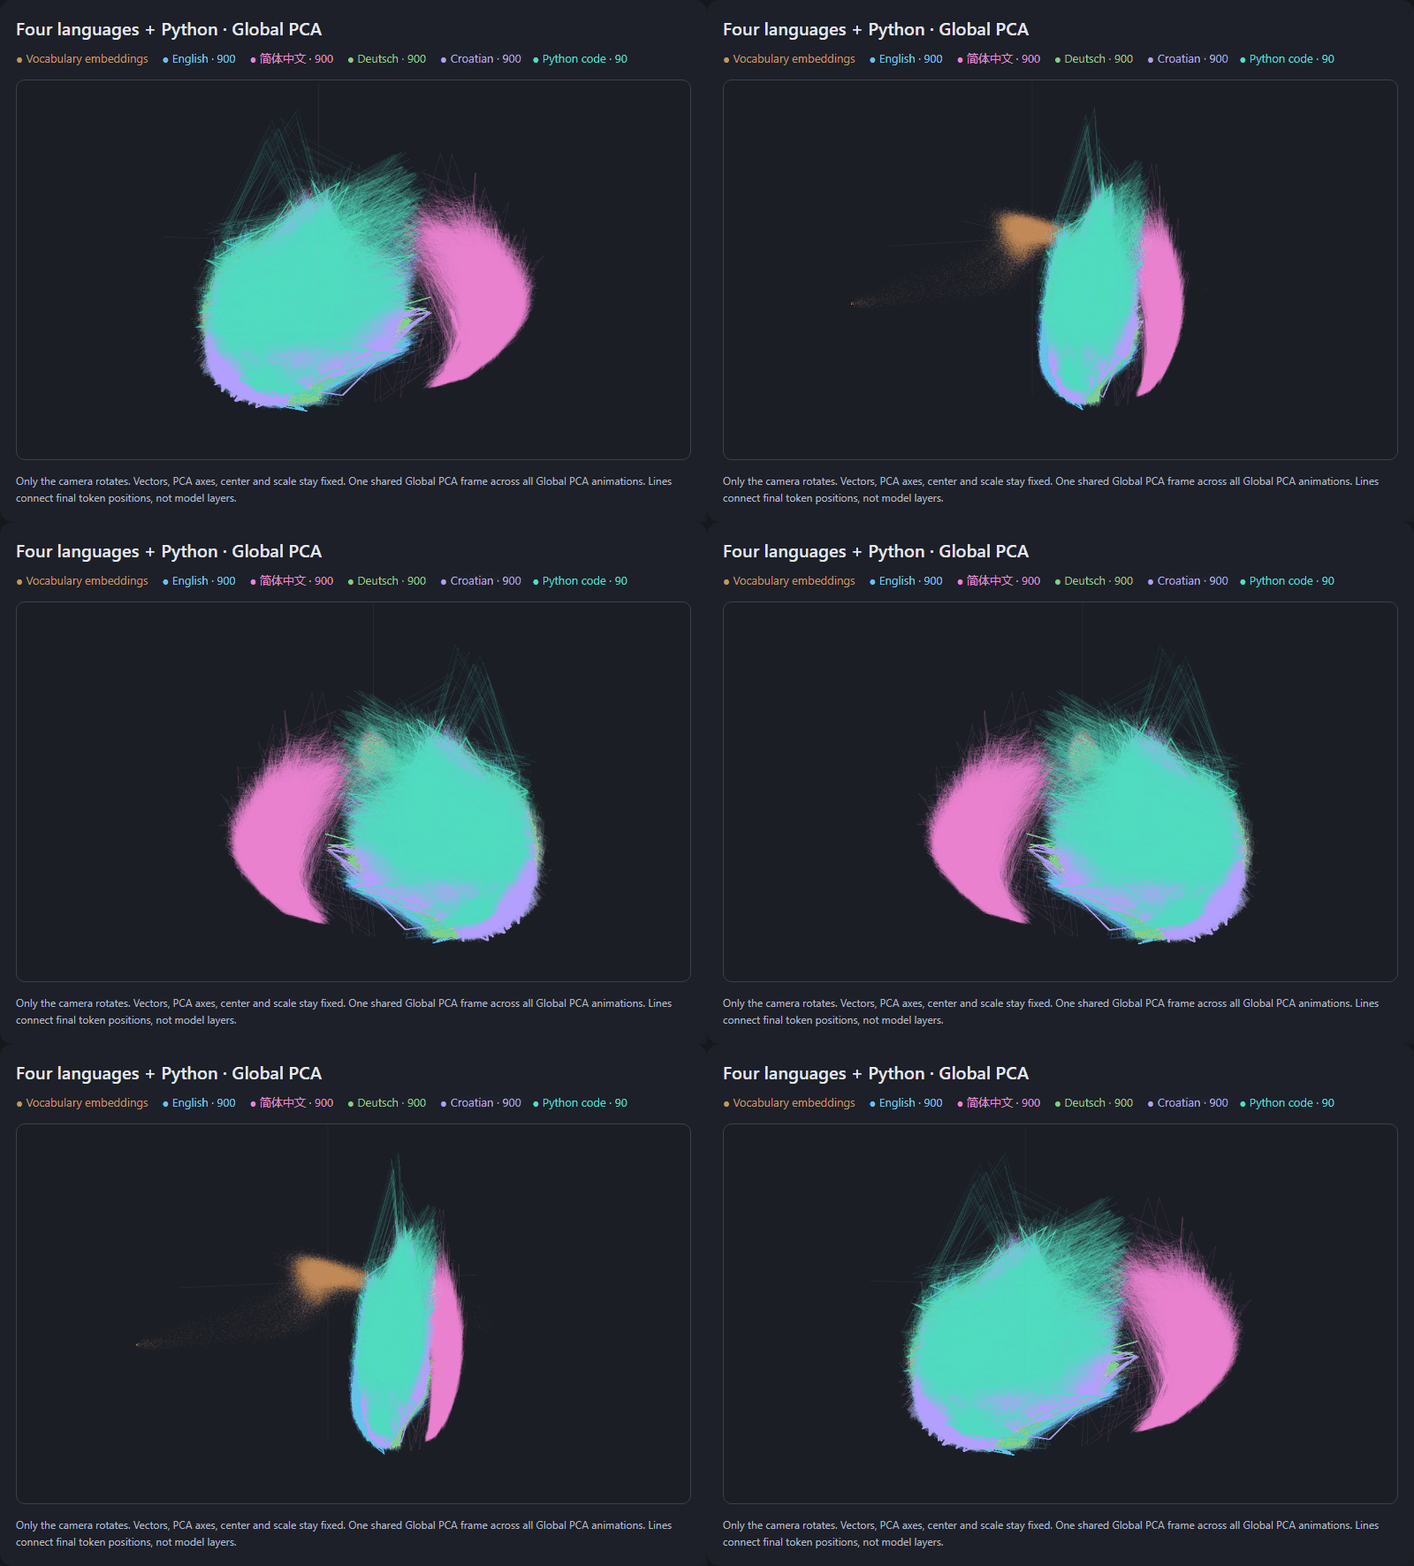
Code appeared in the same broad neighborhood as English and the other Latin-script datasets. Hiding the other languages makes that visual comparison easier to inspect.
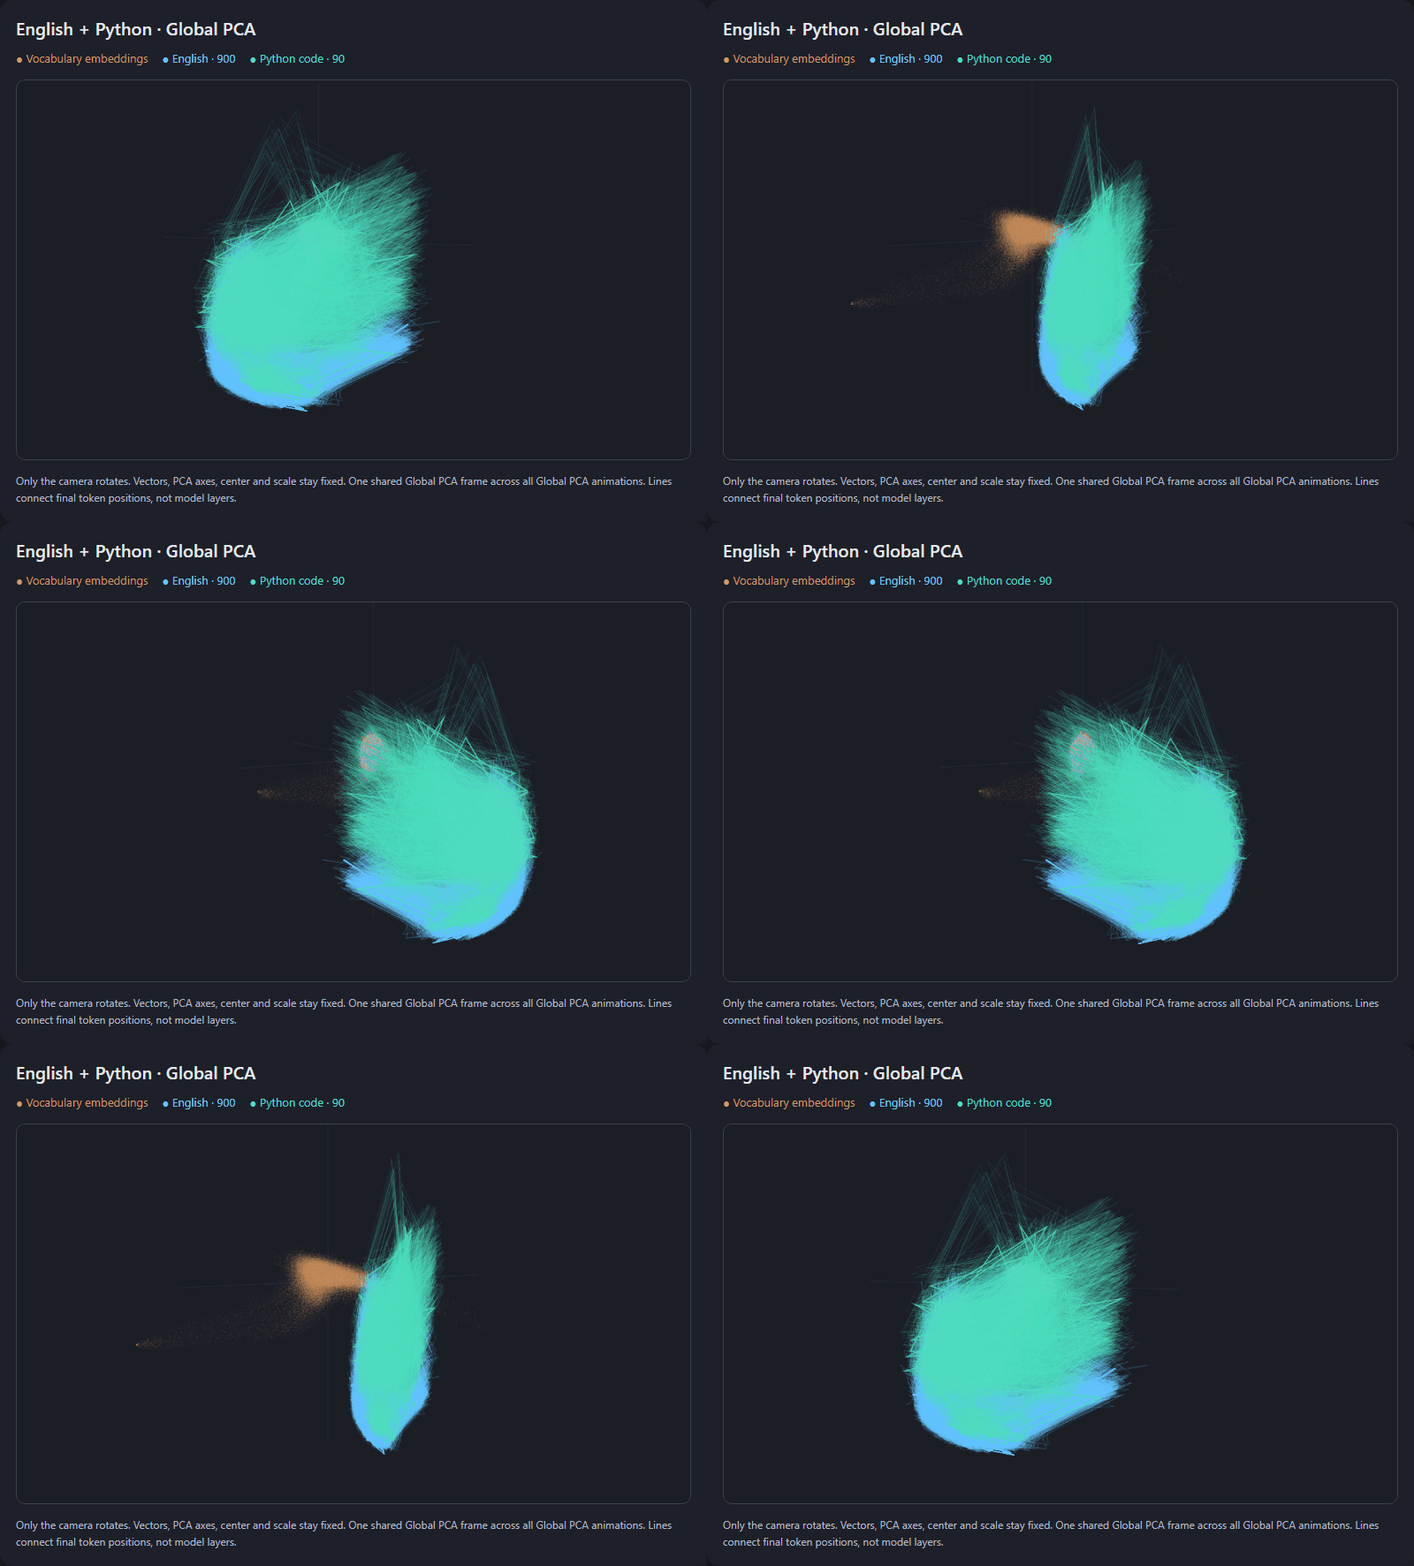
That proximity was interesting, but the construction of the dataset mattered. Python uses English-like keywords alongside punctuation and operators, and each plotted example included its English question as well as its code answer.
Even “close” needed a definition. A simple distance comparison between the projected conversation averages placed the coding dataset closer to Croatian and German than to English. Being in English’s broad visual neighborhood and having English as its closest numerical neighbor were different claims.
When we call code a language, are we talking about its symbols, its structure, or its purpose? In this experiment, several of those properties were entangled in the same examples.
The Global PCA fit contained 151,936 normalized input embeddings and 3,690 conversation averages. Vocabulary embeddings accounted for roughly 98% of its fitting points.
PCA does not know which observations I consider most interesting. It finds directions that explain variation in the data I give it.
So I tried Conversation PCA: choose the directions using the conversation averages alone, then project the same saved token states and embedding table into that new frame.
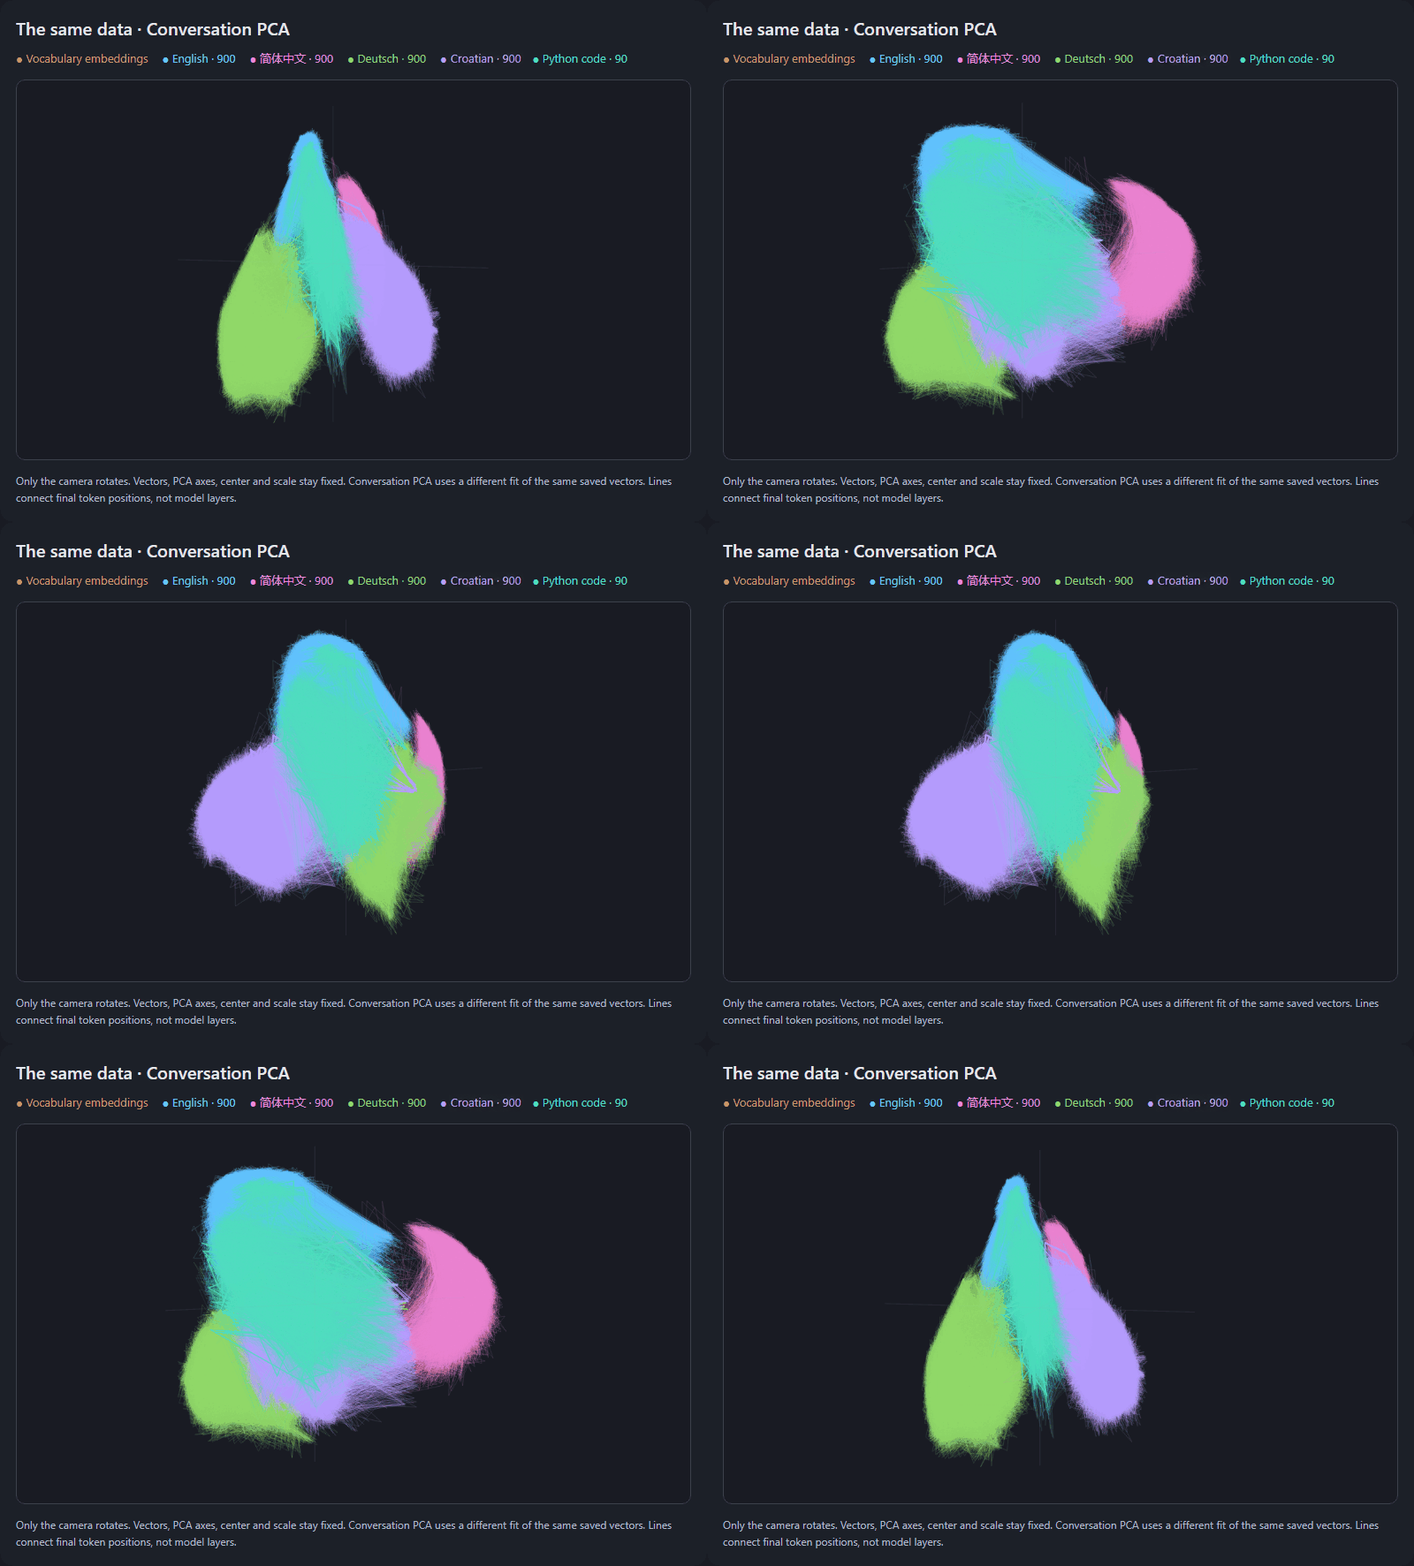
The relationships became visible through a different geometry. German and Croatian spread into more distinguishable regions, while substantial overlap remained.
The change was measurable. The three Conversation PCA directions captured 80.1% of the variation between conversation averages. The three Global PCA directions captured 42.4% of that same average-vector variation.
Those percentages describe conversation averages. The token paths are shown in the resulting frame, but they were not the points used to fit it.
This exposed an important choice inside the visualization: what should the map be optimized to preserve? A vocabulary-oriented frame and a conversation-oriented frame can emphasize different relationships in the same underlying representations.
I checked the apparent flatness against all 264,571 final token states in their original 2,048-dimensional space.
| Measurement | Result |
|---|---|
| Visible 3D variation contained in a best-fitting plane | 99.7% |
| Full token-state variation captured by the displayed Global PCA axes | 17.6% |
| Full variation captured by the best possible 2D plane fitted in 2,048 dimensions | 28.7% |
| PCA directions needed to retain 90% of full token-state variation | 684 |
The visible sheet contained almost all the variation in the 3D view, but that view left out 82.4% of the original variation. Even the best plane fitted in the full space captured only 28.7%, with a similar 28.4% on held-out topics.
At the same time, 17.6% in three directions is a substantial concentration. If variation were spread equally across all 2,048 directions, three would account for only about 0.15%. The observed share was roughly 120 times that reference.
The axes strongly tracked language, with topic structure still present after accounting for language. This connects to earlier research on language-sensitive and shared geometry in multilingual models. These measurements describe associations in this dataset and projection.
In this post, we took an exploratory look at how conversations appear in the residual vector space an LLM uses to process text. In our three-dimensional view, thousands of conversations formed thin, overlapping sheets. Different languages and code traced paths through partly shared regions, revealing a common geometric structure across the examples.
A reader asked: does Chinese occupy a different region from English because of the language itself, or because of its writing system? This gets at the original question: how much of the map reflects meaning, and how much reflects written form?
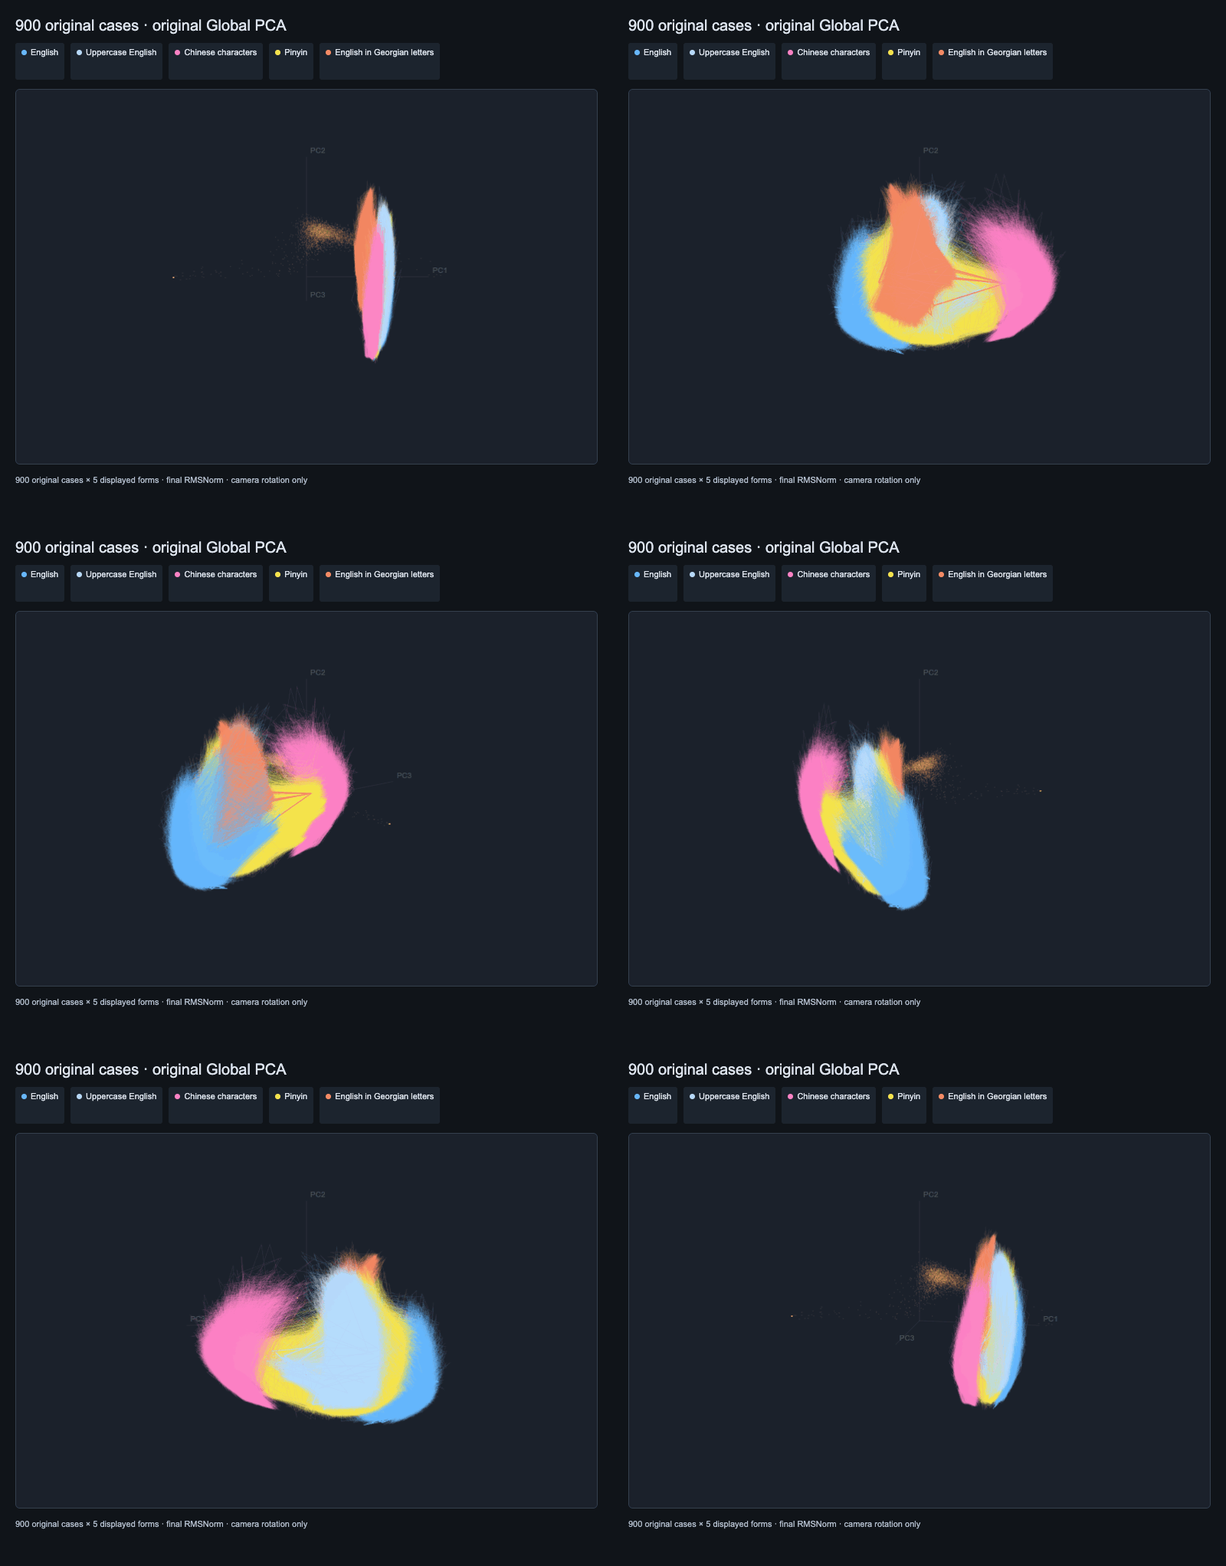
I took the original 900 Chinese question-and-answer pairs and transcribed them into tone-marked Pinyin – Mandarin written with Latin letters. The words and saved answers stayed the same; the writing changed. I fed both versions through the same frozen Qwen model, without training it.
I checked two things: the average position relative to English, and whether corresponding cases still lined up. For the second check, I removed each dataset’s overall offset, then asked: does a Chinese example about photosynthesis find its matching English example among all 900 candidates?
| Written form | Average distance to English ↓ | Matching English case found |
|---|---|---|
| Chinese characters | 0.996 | 471/900 |
| Pinyin | 0.692 | 28/900 |
Pinyin moved closer to English overall, but corresponding examples lined up much less often. A closer average position did not mean better alignment of shared content.
This does not settle language versus writing system. Tokenization, text length, familiarity and Pinyin’s ambiguity still matter. It does not show that changing script changes reasoning.
The chart also shows English in Georgian letters. Georgian is the language of the country Georgia; its alphabet includes ა, ბ and გ. I borrowed those shapes as a letter-swap code for English, as shown below. This is English with different symbols, not a Georgian translation. Qwen was not taught this code, so unfamiliarity can also affect its representation.
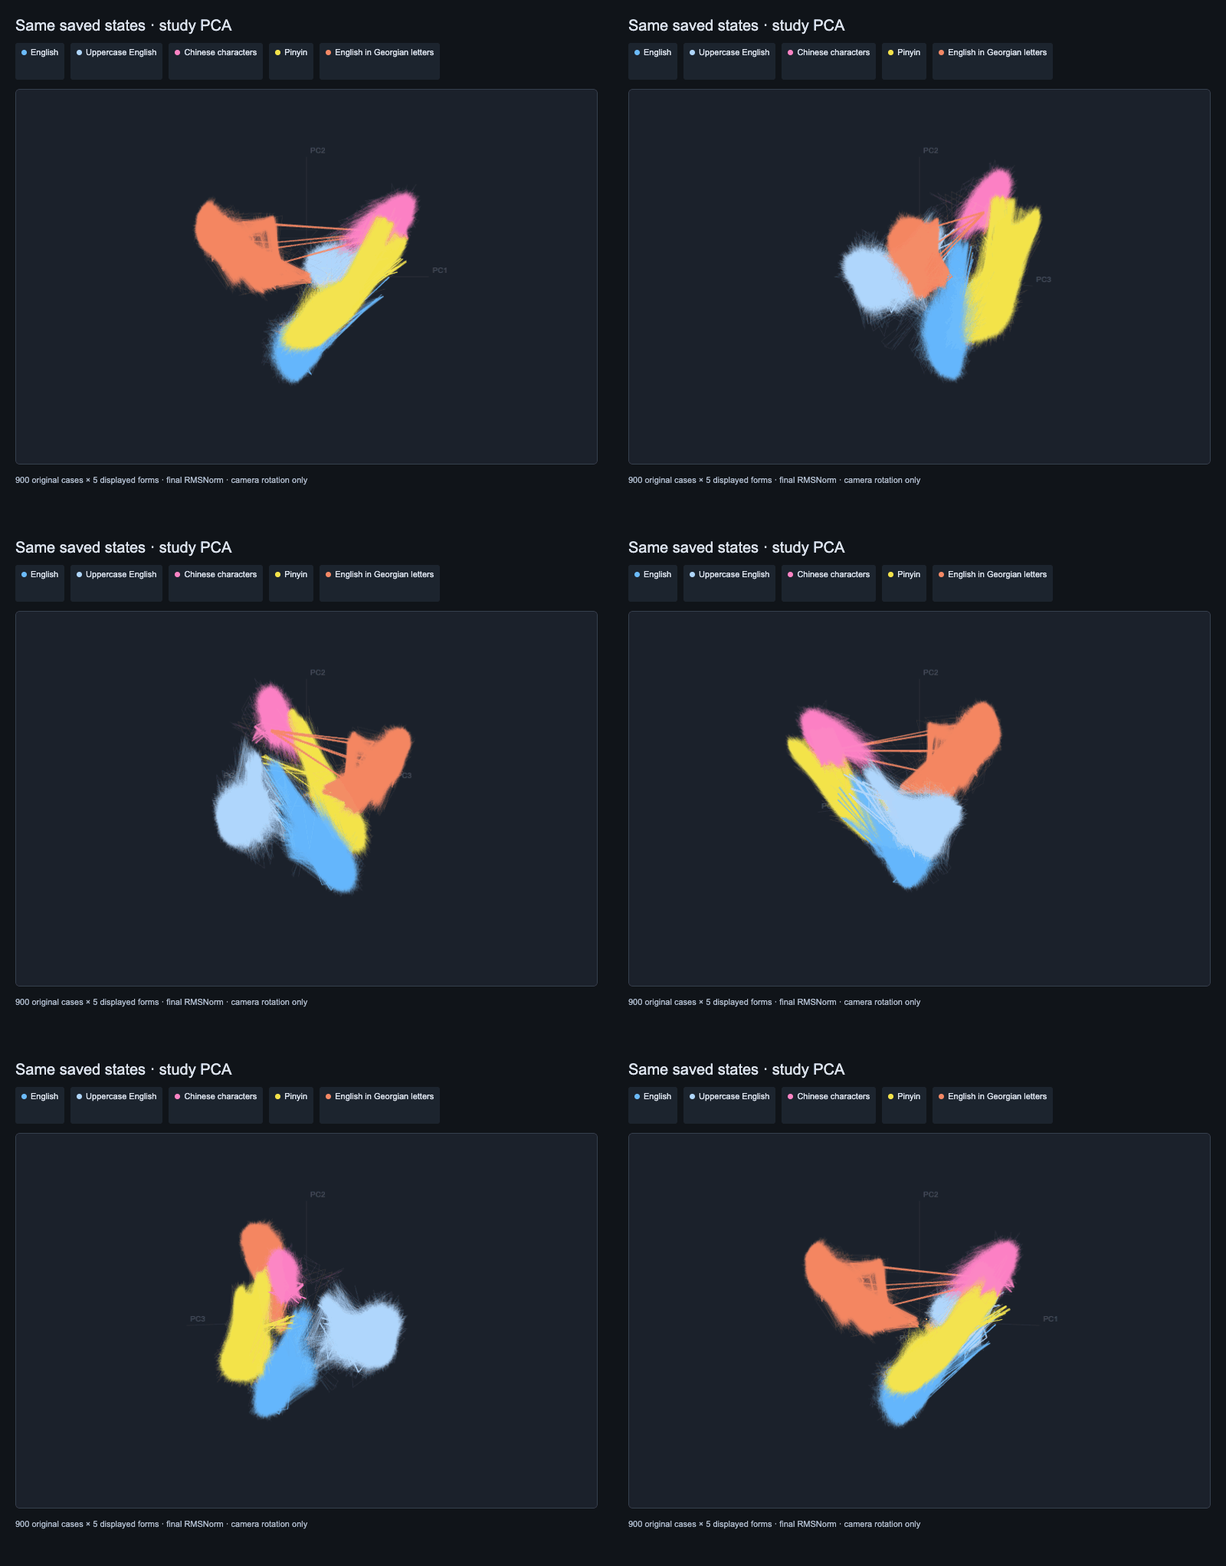
These results do not show that meaning is absent from these vectors or stored somewhere else. Averaging token states into one point loses detail. Meaning may depend on patterns across tokens and successive layers, but this experiment did not test that possibility.
Closeness therefore cannot be read directly as shared meaning or understanding.
Methods, other controls and dataDistances use all 2,048 dimensions at final RMSNorm, not the 3D picture. Each token vector was unit-normalized before averaging. Case matching subtracts each condition’s own centroid, then uses cosine similarity over 900 English candidates. The same cases supply centering and evaluation; this is descriptive, not a held-out test. English and Chinese share question intents and case IDs, but their original answers were independently generated, not exact translations. Pinyin transcribes both the saved Chinese question and answer; pronunciation choices and lost character distinctions can change what is recoverable.
The full run has six conditions × 900 cases = 5,400 inputs. Uppercase and an artificial substitution alphabet transform the original English pairs. The alphabet substitutes Georgian characters for English letters; it is neither Georgian language nor Pitman. Pitman’s graphical strokes were not tested in this text-only model.
Indonesian uses 900 fresh Qwen answers to translated questions alone, with no supplied answer. It matched the English case 431/900 times. Generation used frozen base Qwen3-1.7B, adapters disabled, thinking off, greedy decoding, a 256-token limit, batches of eight and seed 43. All raw outputs and mistakes remain; none reached the token limit. Question review restored omitted closing requests in 145 diagnosis prompts and regenerated affected outputs. Unchanged answers retain their earlier provenance.
Tamil is excluded from this run: eight native-instruction checks and six English-instruction controls did not establish coherent generation in this setup. This is not a universal claim about Tamil support. Its translated-input results remain in the earlier study below. Translations and transcriptions were not independently native-speaker certified; these are not proficiency scores.
Seven checkpoints were captured: embeddings, residuals after layers 1/7/14/21/28, and final RMSNorm. Existing controls reuse verified captures. The study PCA retains 68.6% of variation between this run’s 5,400 final averages; the original Global axes retain 24.1%. These differ from the original article’s 17.6% token-state figure. Repeated question templates and independently generated answer differences also limit interpretation.
| Representation | Mean QA tokens | Distance to English | Cosine to English | Correct case retrieved |
|---|---|---|---|---|
| Original English | 48.95 | 0.000 | 1.000 | Reference |
| Uppercase English | 79.94 | 0.784 | 0.386 | 795/900 |
| Original Chinese characters | 42.65 | 0.996 | 0.088 | 471/900 |
| Tone-marked Pinyin | 146.68 | 0.692 | 0.483 | 28/900 |
| Indonesian · fresh Qwen answers | 76.65 | 0.647 | 0.510 | 431/900 |
| English in Georgian letters | 290.99 | 0.940 | 0.258 | 0/900 |
Measurements · Generation audit · Question review · All 900 Indonesian answers and requests · Language checks and outputs · Independent numerical verification · Source case identities
Previous 900-case comparison with translated answers · 15 November 2026The 12-pair pilot was too small for the comparison I wanted. This expanded run uses the same 900 case IDs and 100 topics as the original language study, with seven representations per case: 6,300 inputs. It reuses the saved conversations.
English and Chinese characters use the exact saved questions and independently generated Qwen answers from the original runs. Pinyin is a tone-marked transcription of those same Chinese questions and answers. Uppercase English and the reversible artificial alphabet transform the same saved English questions and answers. Tamil and Indonesian are machine translations of the saved English question-and-answer pairs.
That distinction matters: the Chinese/Pinyin comparison changes the written representation of the same saved answer, while the English/Chinese comparison still includes independently generated answer differences. The seven conditions are aligned by case ID, but they are not seven independently certified translations of identical answers.
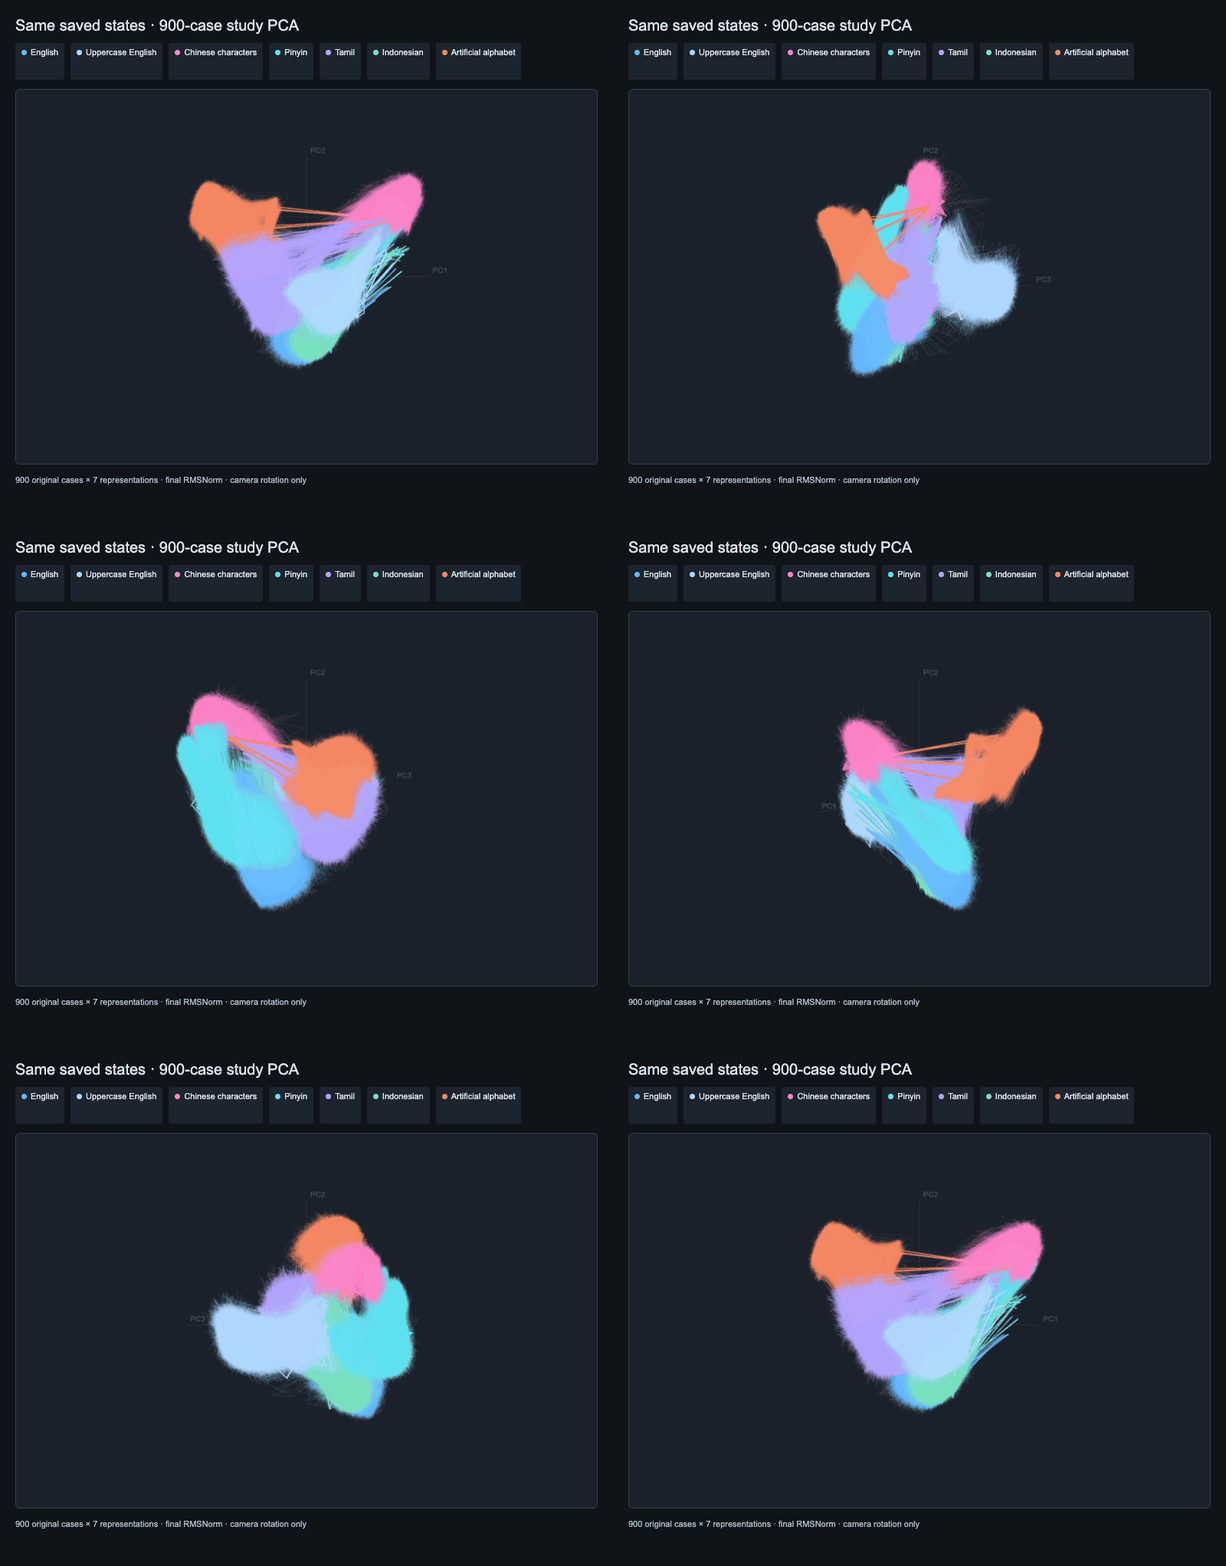
The model is still frozen base Qwen3-1.7B, with no adapter or training. Every input was captured at seven checkpoints: input embeddings; residuals after layers 1, 7, 14, 21 and 28; and final RMSNorm. Each full 2,048D token vector was unit-normalized before averaging. Example means and condition centroids were not normalized again. The figures below show the final RMSNorm states of all 900 cases per condition; lines join successive token positions.
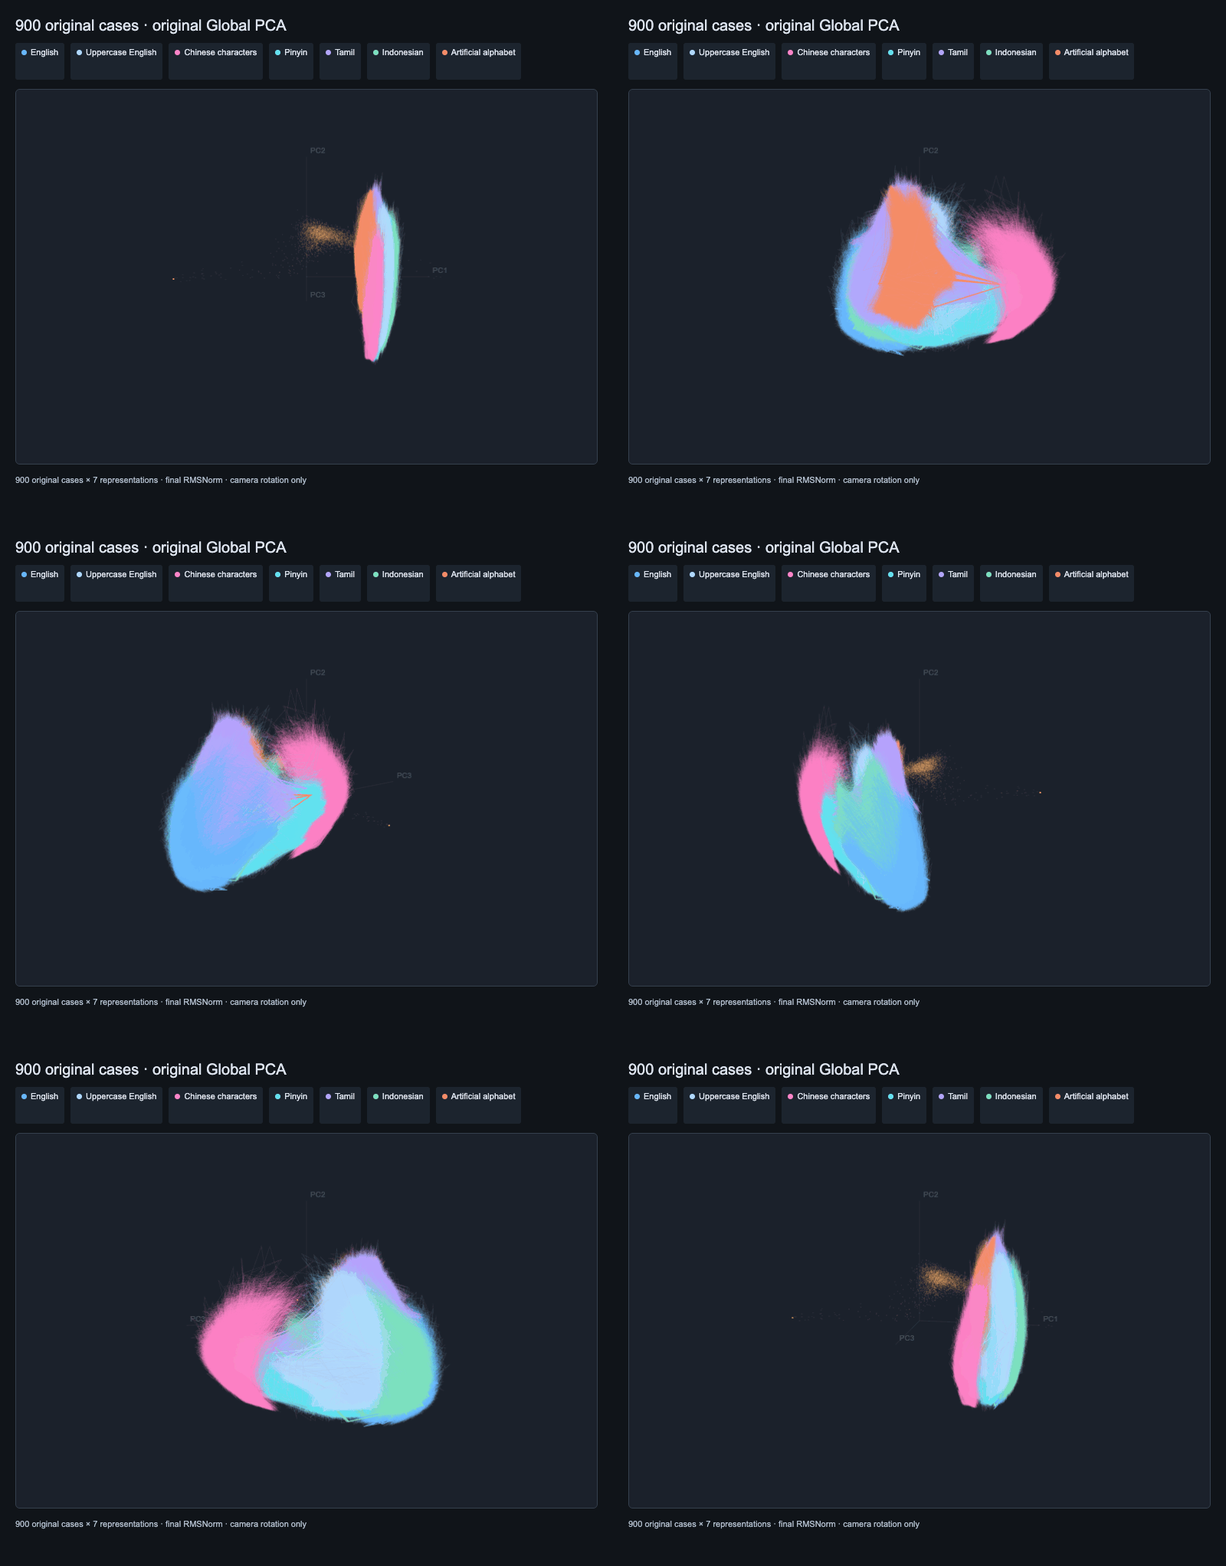
At final RMSNorm, Chinese characters have centroid distance 0.996 and centroid cosine 0.088 to English. Pinyin has distance 0.692 and cosine 0.483. These are measurements in all 2,048 dimensions, not distances read from the 3D picture.
To test individual-case alignment, I subtracted each condition’s own centroid and searched all 900 English cases by full-dimensional cosine similarity. Chinese characters retrieved the matching English case 471/900 times; Pinyin did so 28/900 times. Pinyin’s centroid is closer to English’s, but its individual-case retrieval is lower. The exact-case search is harder than matching one of 12 examples, so its raw count should not be compared directly with the pilot’s retrieval score.
| Representation | Mean QA tokens | Distance to English | Cosine to English | Correct case retrieved |
|---|---|---|---|---|
| English | 48.95 | 0.000 | 1.000 | Reference |
| Uppercase English | 79.94 | 0.784 | 0.386 | 795/900 |
| Chinese characters | 42.65 | 0.996 | 0.088 | 471/900 |
| Tone-marked Pinyin | 146.68 | 0.692 | 0.483 | 28/900 |
| Tamil translation request | 336.76 | 0.793 | 0.160 | 197/900 |
| Indonesian translation request | 74.14 | 0.636 | 0.529 | 650/900 |
| Artificial English alphabet | 290.99 | 0.940 | 0.258 | 0/900 |
Directly matching Pinyin to its Chinese-character source retrieved the correct case 105/900 times after centering. That comparison holds the saved Chinese question and answer fixed. The reverse transcription is not guaranteed to be unique: Pinyin loses character distinctions, and automatic pronunciation choices can introduce errors.
All centroids and retrieval scores here use the same 900 cases for centering and evaluation. They are descriptive results, not held-out generalization. The original data reuse nine question templates per topic, and related cases can have similar or repeated answers. More cases do not remove those construction choices.
There is no 900-question multiple-choice score here. The original questions are open-ended, and this run does not have independently certified A/B/C gold answers. The earlier 12-question checks and the model’s mistakes remain in the pilot below; their scores do not apply to these 900 cases. Retrieval is an alignment measure, not an answer-correctness or language-proficiency score.
Pinyin was produced with pypinyin, using tone marks, dictionary-selected pronunciations, spaces between syllables, and no tone-sandhi rewriting. Non-Chinese text and punctuation were preserved. Tamil and Indonesian use NLLB-200 distilled 600M, run locally on the CPU with int8 inference and beam size 4. Each saved English question and answer was translated separately, with exact input and output tokens retained. Decoding settings are recorded per segment; a repetition guard was added after repetitive outputs were observed. Four inspected Tamil question mistranslations received documented coordinator corrections, with the automatic outputs preserved. Preliminary Qwen and M2M-100 translation attempts were archived after spot checks exposed severe repetition and translation errors; neither is used in these results. Automatic translation can still omit or alter meaning, so these conditions should not be treated as certified semantic matches. None of these translations or transcriptions was independently native-speaker certified.
Tokenization, sequence length, familiarity, translation quality and transliteration ambiguity remain confounders. This experiment does not prove that changing script changes reasoning. The artificial alphabet substitutes Georgian characters for English letters; it is neither Georgian language nor Pitman shorthand. Pitman was not measured: the converter produces graphical strokes, while this model is text-only.
Expanded measurements and methods · Independent numerical verification · Source case identities and provenance · Translation review and corrections
Earlier 12-case pilot, retained for comparisonA reader asked the control question my original comparison could not answer: was Chinese separated from English because of the language, or partly because of how it was written? What would happen if we changed the representation while keeping the intended content fixed?
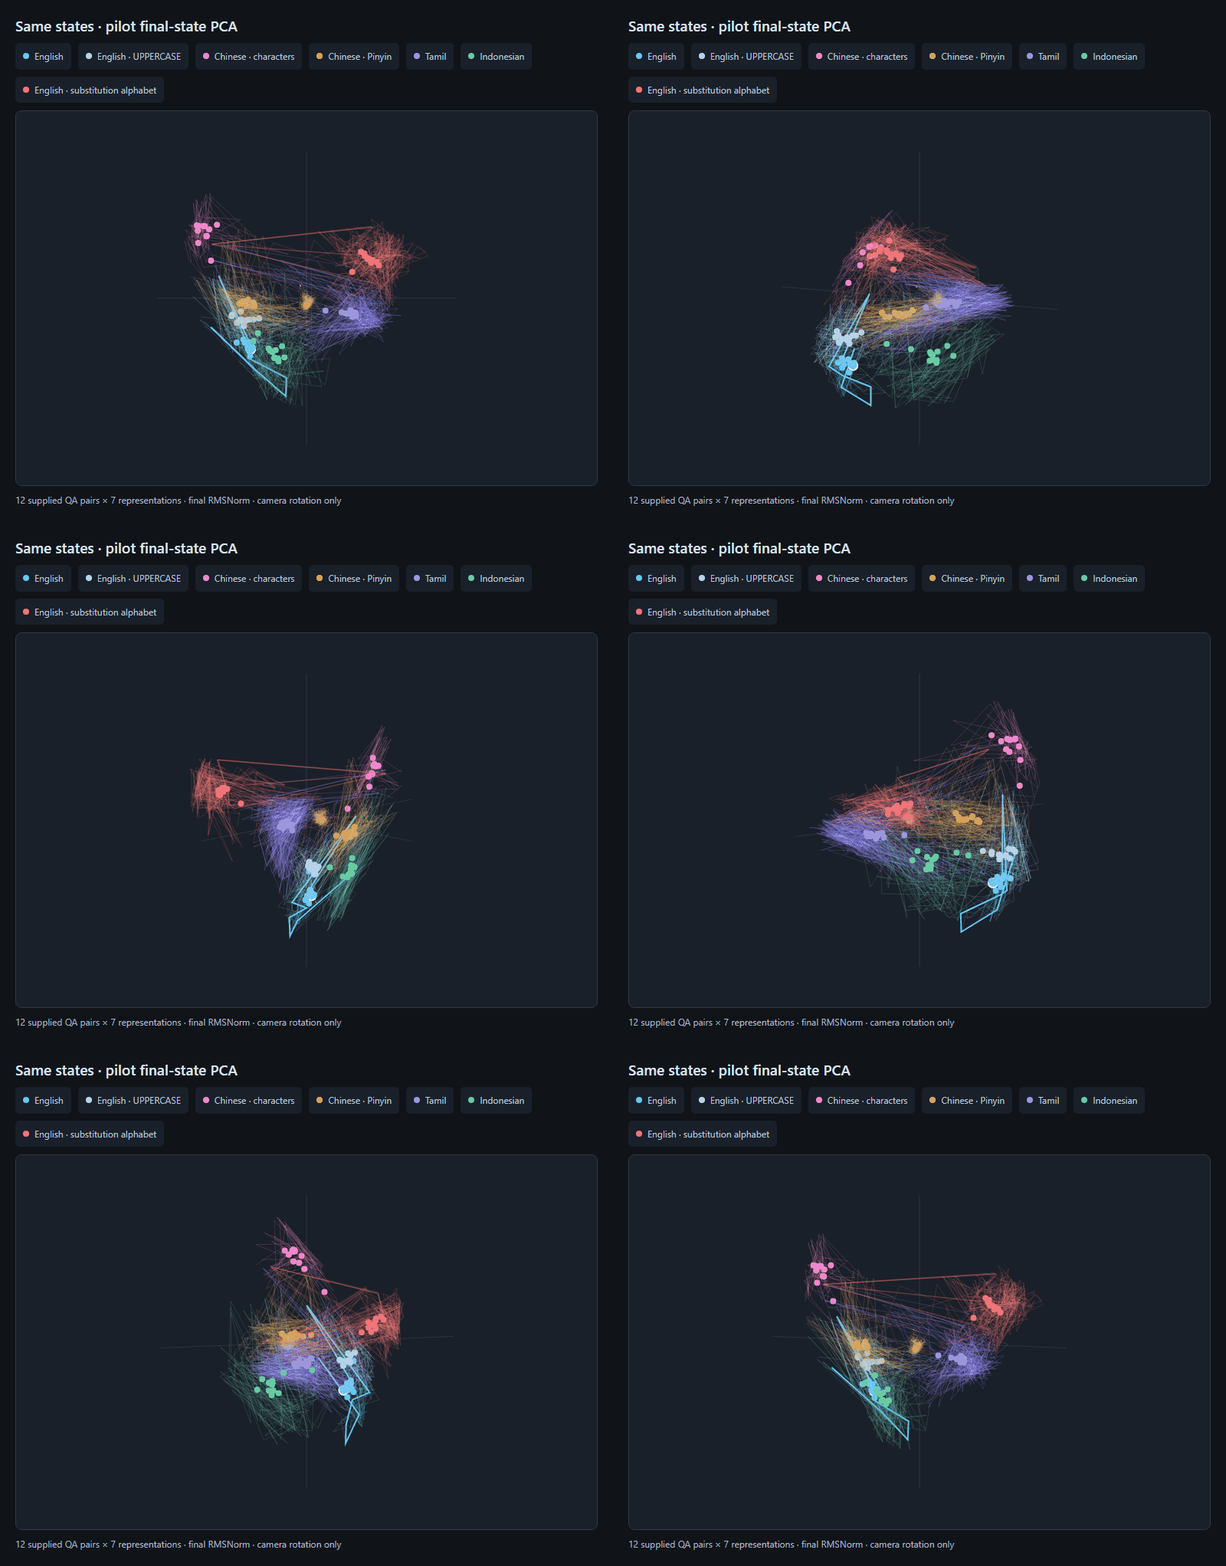
I ran a small pilot with 12 fixed question-and-answer pairs in seven representations: ordinary English, uppercase English, Chinese characters, tone-marked Pinyin, Tamil, Indonesian, and English encoded with a reversible artificial alphabet. Tamil supplied a Dravidian example; Indonesian supplied an Austronesian example. The artificial alphabet uses Georgian characters as substitutes for English letters; it is neither Georgian language nor Pitman shorthand.
These 84 inputs are separate from the original 900-example datasets. Their short questions and supplied answers were prepared by the coordinator, rather than generated independently by Qwen. Each representation expressed the same intended facts. Translations and pronunciation transcriptions were not independently certified by native speakers.
The base Qwen3-1.7B model stayed frozen, with no adapter or training. I recorded input embeddings, residuals after layers 1, 7, 14, 21 and 28, and final RMSNorm states. The following pictures show final token states, unit-normalized in the full 2,048 dimensions before averaging or projection. Lines connect token positions within a supplied example.
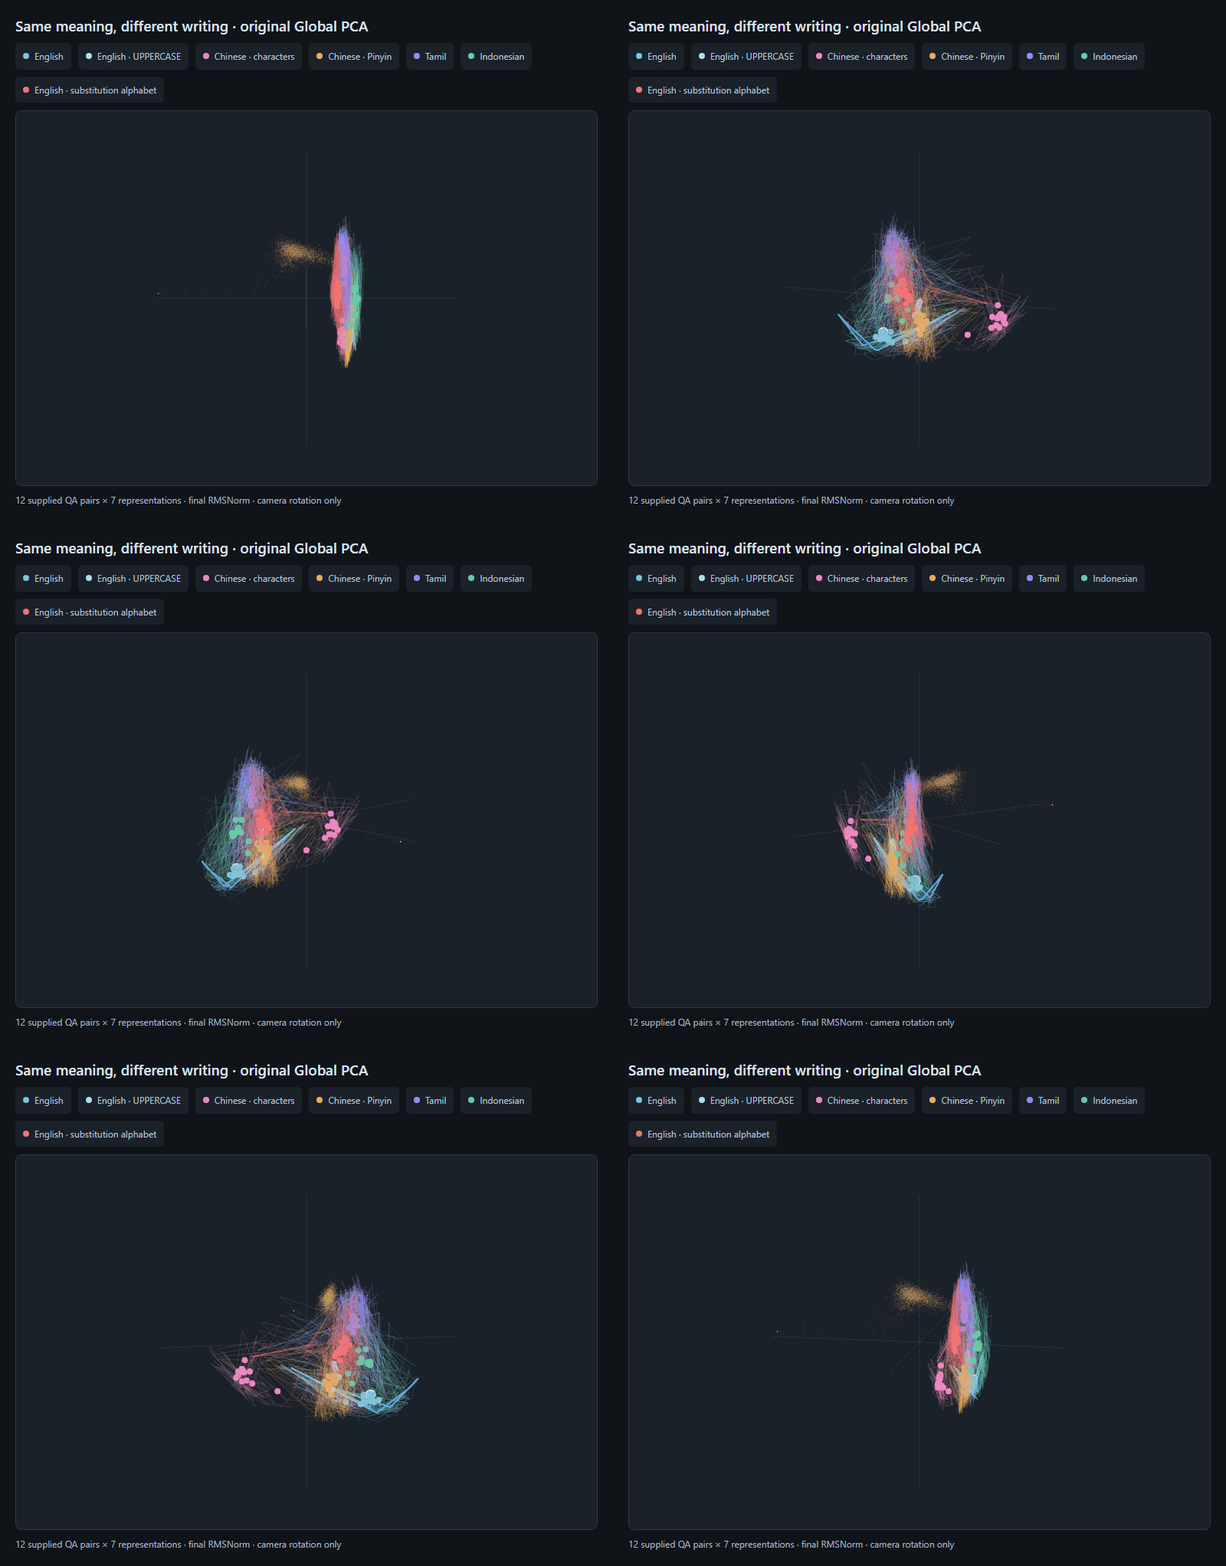
Pinyin's final-state centroid was closer to English's than the Chinese-character centroid was: 0.578 versus 0.781, measured in the full 2,048D space. The same ordering appeared in centroid cosine similarity: 0.695 versus 0.518. These centroids average the per-example means of unit token vectors; their lengths are not normalized again.
That is consistent with written representation contributing to the geometry. It does not isolate a visual effect of letter shape. This text-only model receives token IDs, and Pinyin changed tokenization, sequence length and likely familiarity as well as the writing convention. The same 12 pairs averaged 9.7 Qwen tokens in Chinese characters and 23.8 in Pinyin.
The more interesting result appeared when I asked whether individual examples still lined up. I subtracted each representation's own centroid and searched for the corresponding English case by full-dimensional cosine similarity. Chinese-character examples retrieved the matching English case 12/12 times; Pinyin did so 5/12 times. This was a descriptive test within the same 12-item pilot, with no held-out evaluation. It is a measure of this chosen representation and distance metric, not a translation-quality score.
The cloud's overall location and the alignment of its individual examples were telling different stories.
I also tested comprehension separately. Qwen received each question without its supplied answer, with identical English multiple-choice options and an instruction to return A, B or C. Gold positions were balanced; random guessing would average 4/12. Generation used base weights, thinking off, greedy decoding, and an eight-token output limit. The model's actual outputs, including errors, are saved in the app.
| Representation | Mean tokens per supplied QA | Correct comprehension checks | Paired retrieval to English |
|---|---|---|---|
| English | 10.58 | 10/12 | Reference |
| English · UPPERCASE | 13.25 | 11/12 | 12/12 |
| Chinese · characters | 9.67 | 11/12 | 12/12 |
| Chinese · Pinyin | 23.83 | 9/12 | 5/12 |
| Tamil | 48.50 | 11/12 | 9/12 |
| Indonesian | 14.25 | 10/12 | 12/12 |
| English · substitution alphabet | 41.17 | 5/12 | 2/12 |
Twelve elementary questions cannot establish language proficiency or rank languages. The shared English choices also make this a particular cross-language task. The scores do show why comprehension needs to accompany a geometric comparison: an unfamiliar encoding can move vectors while making the text harder for the model to interpret. English itself made mistakes on two checks, and the errors remain in the record.
Uppercasing English supplied another useful control. Its cloud moved, but all 12 case matches to ordinary English survived after centering. The unfamiliar alphabet produced only 2/12 such matches and 5/12 correct checks. Neither change altered the intended English facts. These controls suggest that location, content alignment and task behavior should be measured separately.
Pitman was not measured. I found an online converter that renders Pitman strokes, but the loaded Qwen model cannot consume those images. I have not relabeled the artificial alphabet as shorthand or claimed a Pitman result. A font-only change would leave the input token IDs unchanged.
This pilot also differs from training a model equally on two writing systems. Qwen’s pretraining exposure was not controlled, and no new script was taught here. Tokenization, sequence length, familiarity and transliteration ambiguity remain confounders. This experiment does not prove that changing script changes reasoning. A larger follow-up would need independently reviewed parallel text, stronger familiarity and token-length controls, and evaluation across topics kept out of analysis design.
The compact measurements record the numerical results and methods. The separate Writing systems experiment in the local research app retains the model prompts and outputs, including mistakes; those outputs are not included in this blog’s compact measurements.
The map now raises two distinct questions: where does a form of writing place an example, and what relationships between examples survive that change? Keeping those questions separate made the geometry more informative.
Texto de operator0x.com tal como lo publicó, leído de su página y mostrado aquí con el formato de El Autómata. El original, en operator0x.com · Volver a la noticia de El Autómata