Shipping 103,802 Dots in 82 KB
How we packed our hand plotted dot art into a very compact binary format, reduced geometry delivery by 93% and stopped rendering the…
How we packed our hand plotted dot art into a very compact binary format, reduced geometry delivery by 93% and stopped rendering the…
11 min read
Oct 25, 2026
--
We do sell AI powered search and we use AI/LLMs for a whole host of things on a day to day basis at Layers but art generation is not one of them and that’s on purpose.
Every illustration on uselayers.com was drawn by Alberto Larizza. Alberto is one of my closest friends and a fantastic pattern designer. He’s from Tuscany and did pattern work for houses like Gucci in Italy prior to coming over to the US.
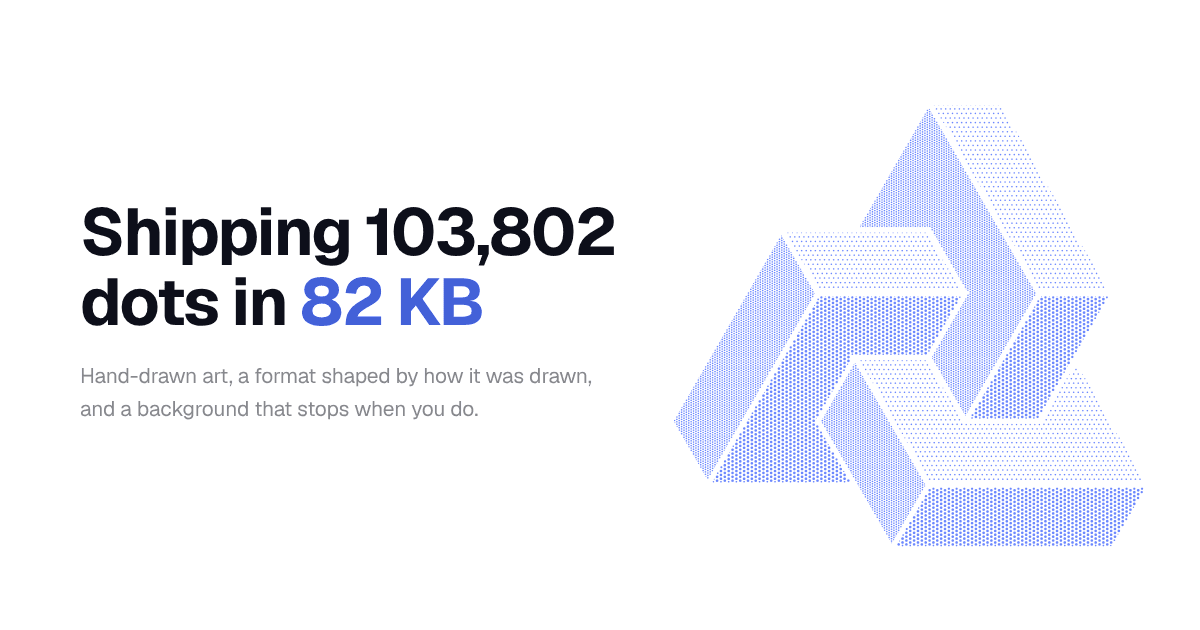
He drew it all in dots. 103,802 of them across 13 illustrations, each dot placed by hand over a number of months earlier in the year.
We’ve always wanted them to move. This month Sumit, one of our product designers, finally got around to it, and the prototype was beautiful:
Hover over one and the dots get pushed out of the way and then spring back. Tap it, and a shockwave goes through.
There was one problem: the prototype had an 8MB JSON file that had every dot from the SVG. I had to figure out how to feasibly get these into the browser and have it work for lower-end devices w/o any jitter or lag on the page.
Press enter or click to view image in full size
Alberto did the Illustrator artwork. Sent over as SVG exports (65 files, a few zips at around 175MB) and 13 of those ended up on the site.
Illustrator doesn’t export a dot as a dot. You end up with a mixture of <circle>, <ellipse> and <path> elements and any dot that’s been clipped or expanded will come out as a little bezier path with its own fill attribute.
The security padlock is a perfect example: 2,510 circles, 470 ellipses, and 3,644 paths, which comes to precisely 6,624 dots in around 730KB.
The browser only needs x, y and a radius per dot so step one was converting each SVG down to that:
There’s not much to say about the conversion really. The rest of this post is about getting 1.25MB down to 82KB.
The initial version shipped a Float32Array per illustration: [width, height, x, y, r, x, y, r, …], little-endian. 12 bytes a dot.
// The original loader
const floats = new Float32Array(await res.arrayBuffer())
return {
  width: floats[0],
  height: floats[1],
  dots: Array.from(floats.subarray(2)),
}
Float32 is around 7 significant digits. The widest example is 900px in source units and it renders at a few hundred CSS pixels. 412.3871 and 412.3906 end up on the same pixel so most of those digits are effectively wasted.
(Same version also ran the hero background loop at 60fps continuously, even if the mouse was just sitting still. Getting to that.)
Before I went to any format I spent a bit of time fiddling with the files.
The first thing I noticed was rows. If you sort by y and then x, 78% to 99% of dots have the exact same y as the dot right before them.
Alberto builds the pattern row by row and it appears in the numbers.
Radii are pretty much limited too. The original nine illustrations each have somewhere between 104 and 228 distinct radius values. The three latest have 900+ (again that’s our SVG converter reading the radii off the bounding boxes, float noise). 8-bit quantization will have flattened that out anyway.
X is where the entropy is. Nearly every x is fractional, and the neighbors in a row are a few px apart.
I didn’t write a clever codec at all. I just laid the data out so the compressor could see the rows.
DOT2 is the format I went with. It’s built at deploy time via a small Node script and the decoder is around 40 lines.
Encoding, in order:
Compressed one plane at a time the y deltas reduce to 8% of their original size and the x deltas get down to 25%.
5 bytes per dot before compression. With Brotli it’s 0.79 on average.
Encoder inner loop:
const x = Math.round((dots[j] / width) * 65535)
const y = Math.round((dots[j + 1] / height) * 65535)
view.setUint16(HEADER + i * 2, (x - previousX) & 65535, true)
view.setUint16(HEADER + count * 2 + i * 2, (y - previousY) & 65535, true)
view.setUint8(
  HEADER + count * 4 + i,
  Math.round((dots[j + 2] / maxRadius) * 255),
)
Decoder side:
x = (x + view.getUint16(HEADER + i * 2, true)) & 65535
dots[i * 3] = (x / 65535) * width
On the 900px illustration one uint16 step is approximately 0.014px. Worst center error after a round trip across all assets: less than 0.011px. Worst radius error: less than 0.0065px.
It’s lossy, no doubt about it. I wasn’t going to trust the maths on that so there’s a pixel by pixel comparison further down.
The decoder validates prior to allocation. It checks the DOT2 magic (which is also the version), checks the flags, caps the caps count at 100k, checks the bounds on width and height and requires the buffer to be exactly 24 + count x 5 bytes.
Anything off and it throws, and you keep seeing the PNG that was already there.
Halfway through writing this I went to explain why each step had been useful and realized I’d never actually measured the steps, only the final number.
So I went back and ran Brotli q11 over every intermediate layout, all 13 assets:
I would have got the majority of this wrong if you’d asked me before hand.
So: 93% smaller than the uncompressed source, and 63% smaller than Brotli on the original floats. The 63% is the one I care about, since the 93% mostly measures “you weren’t compressing before.”
Browsers already do the decompression of Brotli and gzip so I’ve skipped a WASM decoder or a decompression library. Delivery was all about serving the correct file with the correct headers.
Join Medium for free to get updates from this writer.
Remember me for faster sign in
`npm run dots` takes each .dots.bin path, writes out the compact files and a manifest to its corresponding .dots URL (hashed). The pages continue to reference the original paths and the component then looks up the hashed one.
A Cloudflare Worker handler only matches against paths in the manifest. It correctly parses Accept-Encoding (q values, identity;q=0, all of it) and then serves the .br, the .gz or the raw file. The browser does the decompression and the client then decodes the entire buffer into a Float32Array.
Content-Type: application/octet-stream
Content-Encoding: br
Vary: Accept-Encoding
Cache-Control: public, max-age=31536000, immutable
immutable is fine as the hash is in the filename. Change the art and you get a new URL. The old hashed files remain so the cached pages don’t 404 their dots.
Two smaller things in the handler:
Codec tests were green from the start. The page was still broken in local preview.
The preview bridge decompresses responses on the way through but kept the compressed Content-Length. So decoded bytes showed up with the old, smaller length and got truncated. The decoder’s length check caught it and threw (good, that’s its job).
Fix was deleting Content-Length and piping the body through an empty TransformStream so that nothing downstream had a length to forward. I reproduced it in an isolated Miniflare runtime rather than a mocked Response as the mock would have just happily passed.
Smaller files don’t make a frame any faster, though. The illustrations and the background grid are separate engines, and each had its own problem.
The original loader ran Array.from on the Float32Array and then built an object per dot:
// Before: one object per dot, with a color string on each
list.push({ ux, uy, hx: 0, hy: 0, x: 0, y: 0, vx: 0, vy: 0, r: 1, sr, color })
Biggest illustration is 12,115 dots. So 12,115 objects, eleven fields each, plus setting ctx.fillStyle on every dot every frame. And every dot is the same color.
Now it’s ten flat typed arrays:
type ParticleBuffers = {
  ux: Float64Array; uy: Float64Array; sr: Float64Array  // source space
  hx: Float64Array; hy: Float64Array                    // home, canvas space
  x: Float64Array;  y: Float64Array                     // current
  vx: Float64Array; vy: Float64Array                    // velocity
  r: Float64Array                                       // radius, canvas space
}
Yes those are Float64Arrays (after I’d spent a whole section cutting precision). The wire format will be small, but the simulation should behave exactly as it did before. JS numbers are doubles so Float64 will preserve the spring maths bit for bit.
fillStyle is set once per frame for single color art (image sampled art still sets it per dot as those are effectively different colors). Each dot still has its own arc and fill. The sleep when settled and pause when offscreen behavior was already in place; I left it be.
The hero background is a grid of glyphs (·, ◦, •, ●) which light up around your cursor and then fade out.
The old loop would touch every cell every frame. Build a string key like “14,22”, do a map lookup, apply the decay, do the brush test and draw. Then just requestAnimationFrame again unconditionally.
At 390×844 with 11 px cells that’s 2,772 cells and 2,772 template strings per frame, ~60 frames a second, on a page where nobody has moved the mouse.
New loop:
// Before
for (every row) for (every column) { /* key, decay, brush test, draw */ }
frameId = requestAnimationFrame(draw)// After
for (const [key, value] of influence) { /* decay active cells only */ }
if (painting) { /* visit only the brush's bounding box */ }
for (const [key, value] of influence) { /* draw active cells only */ }
if (painting || influence.size) frameId = requestAnimationFrame(draw)
Numeric keys (row * columns + column). Decay only walks lit cells. The brush only walks its own bounding box. When the last lit cell fades out, it stops requesting frames; pointer movement or a resize starts it again.
I went through and changed a lot of this at once and benchmarked it all together so I can’t break down the improvement per change.
The obvious next step with the illustrations was to batch up every arc into a single path and then just call fill() once. Thousands of Canvas calls down to one.
I built it and it was faster, though the artwork was different.
When circles are on the same path they get antialiased together rather than individually. The edges which were previously feathering into the background become a bit heavier and the whole image ends up looking a little darker, as if the contrast has been nipped up a bit.
Most people probably wouldn’t notice. The whole point was animating Alberto’s work without changing it, though, so I reverted it and kept individual fills.
I didn’t want to eyeball it so I wrote a benchmark that renders old engine + old data side by side with new engine + DOT2 at DPR 2.
Every illustration (240 and 600 CSS px), once at rest and once after 12 scripted frames of pointer movement plus a shockwave. 52 comparisons.
The cost per comparison: mean channel difference less than 0.2/255 and less than 0.5% of pixels off by more than 16 on any channel.
Worst case was 0.153/255 at rest, 0.134/255 in motion and 0.211% of pixels over 16 (that run was headless Chrome on Linux). The two images below are from an earlier run on macOS.
Merchandising at rest, original on the left:
Toys mid-shockwave, same scripted input on both:
They aren’t pixel-identical, and the numbers above show it. I couldn’t see a difference.
Every dot that Alberto placed is still there, within about a hundredth of a pixel of where he put it. The 13 illustrations come to 82KB on the wire and the grid behind them stops drawing when you stop moving.
The codec itself isn’t what I’m most interested in. It only worked because of the way the art was created. Alberto draws in rows so the data came in rows and the real win was in the way we laid it out so Brotli could see it.
New illustrations go through the same pipeline: illustrator export, a script that pulls the x, y and radius out of the SVG, then npm run dots. Alberto is still drawing by hand. The site just hosts it for less.
If you’re shipping art that someone has made by hand then open the files before you pick a format. How it’s been drawn will usually tell you what format to store it in.
If you like this kind of work, follow along at layers.engineering.
Texto de layers.engineering tal como lo publicó, leído de su página y mostrado aquí con el formato de El Autómata. El original, en layers.engineering · Volver a la noticia de El Autómata